
Revolutionize Data Storytelling: Marketing Your AI Chart Creator for Maximum Impact
Transform your AI-powered chart creation tool into a market leader with these proven strategies, expert insights, and tactical implementations.
Key Marketing Highlights
- User-Centric Positioning: Focus on how your tool reduces complexity, saves time, and democratizes data visualization for both technical and non-technical users.
- Multi-Channel Approach: Implement a strategic mix of content marketing, social media, email campaigns, and partnerships to maximize reach and conversion.
- Value Demonstration: Showcase real-world applications through case studies, interactive demos, and free trials that highlight your tool's unique AI capabilities.
Understanding Your Target Audience
Successful marketing begins with a deep understanding of who will benefit most from your AI-powered chart creation tool. Each audience segment has unique needs, pain points, and expectations that should inform your marketing approach.
Primary Audience Segments
Data Professionals
Data analysts, scientists, and researchers who work with complex datasets daily are looking for tools that enhance efficiency and provide advanced visualization capabilities. Emphasize your tool's ability to handle complex data, suggest optimal visualization types, and integrate with existing data workflows.
Business Professionals
Executives, managers, and decision-makers need to quickly create compelling visuals for presentations and reports. Highlight your tool's ease of use, time-saving capabilities, and ability to generate professional-quality visualizations without technical expertise.
Marketers and Content Creators
These professionals need to translate data into engaging stories. Focus on how your tool can generate social media-ready visualizations, infographics, and interactive charts that capture audience attention.
Educators and Students
Academic users need accessible tools for research visualization and teaching. Emphasize simplicity, educational features, and special pricing options for this segment.
| Audience Segment | Primary Needs | Key Marketing Messages | Preferred Channels |
|---|---|---|---|
| Data Professionals | Advanced capabilities, accuracy, integration | "Transform complex data into clear insights in seconds" | LinkedIn, technical blogs, data science forums |
| Business Professionals | Ease of use, time efficiency, professional output | "Executive-ready charts with zero design skills required" | LinkedIn, business publications, webinars |
| Marketers | Visual appeal, brand customization, sharing options | "Turn data into captivating visual stories that convert" | Instagram, Twitter, marketing blogs |
| Educators/Students | Affordability, simplicity, educational resources | "Make data accessible and engaging for any classroom" | Educational forums, academic conferences, Twitter |
Crafting Your Value Proposition
A compelling value proposition clearly communicates why potential users should choose your AI chart creation tool over alternatives. Focus on the unique benefits and features that set your tool apart.
Core Value Pillars
Time Efficiency
Emphasize how your AI-powered tool automates and accelerates the chart creation process. Quantify time savings where possible ("Create professional charts in minutes, not hours") and highlight features that eliminate manual work such as natural language inputs and automated formatting.
Ease of Use
Highlight the accessibility of your tool for users without technical or design expertise. Showcase the intuitive interface, drag-and-drop functionality, and how AI assists users in making design decisions.
AI-Powered Insights
Emphasize how your tool goes beyond simple visualization to provide data-driven insights and recommendations. Showcase features like trend identification, anomaly detection, and predictive analytics that help users extract more value from their data.
Versatility and Customization
Highlight the range of chart types, customization options, and integration capabilities that make your tool adaptable to various use cases and industries.
Strategic Marketing Channels
To effectively reach your target audience, you'll need a strategic mix of marketing channels tailored to each segment's preferences and behaviors.
Content Marketing Strategy
Blog and Knowledge Base
Create valuable content that educates users about data visualization best practices, AI-driven insights, and specific use cases for your tool. This not only drives organic traffic but positions your brand as an authority in the space.
Video Tutorials and Demos
Create engaging video content that demonstrates your tool's capabilities, showcases before-and-after results, and provides step-by-step tutorials for common use cases.
Case Studies and Success Stories
Highlight real-world examples of how your tool has helped businesses or individuals achieve their goals. Include specific metrics and testimonials when possible.
This video explains how AI is transforming data visualization workflows and how tools like yours can help users create more effective and accessible visualizations.
Digital Marketing Channels
SEO Strategy
Optimize your website and content for search engines by targeting keywords related to data visualization, AI chart tools, and specific use cases. Focus on both short-tail (e.g., "AI chart maker") and long-tail keywords (e.g., "how to create interactive sales dashboards with AI").
Social Media Marketing
Develop a presence on platforms where your target audience spends time. LinkedIn is essential for reaching business professionals and data analysts, while Twitter can help you engage with the broader tech community. Instagram and Pinterest can be effective for showcasing visual examples of your tool's capabilities.
Email Marketing
Build an email list to nurture leads and maintain relationships with existing users. Share product updates, visualization tips, and special offers to keep your audience engaged.
Comprehensive Marketing Strategy Mindmap
Below is a visual roadmap of your AI chart tool marketing strategy, highlighting the interconnected elements that will drive awareness, consideration, and conversion.
Demonstrating Product Value
Interactive Demonstrations
Create interactive demos that allow potential users to experience your tool's capabilities firsthand without requiring a full signup. Use real datasets and showcase the full process from data upload to final visualization.
Free Trial and Freemium Model
Offer a free trial period or a freemium model to lower the barrier to entry. Ensure users can experience the most impressive features during the trial to encourage conversion to paid plans.
Visual Showcase
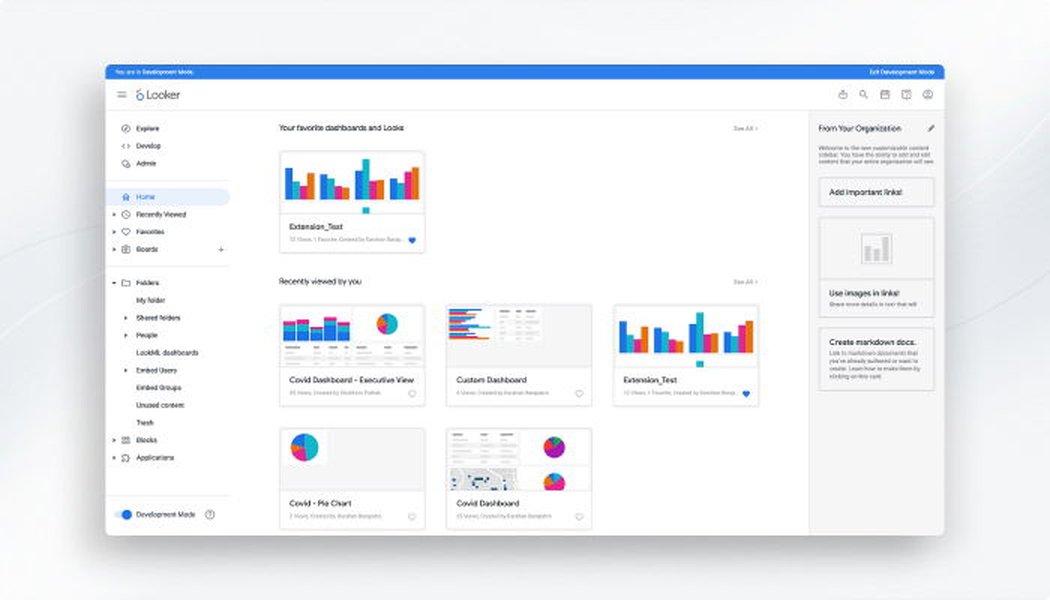

Examples of professional visualizations created with AI-powered chart tools
Frequently Asked Questions
References
- Top 5 AI Data Visualization Tools in 2025 - Zoho Analytics
- 8 AI Data Visualization Tools For Powerful Insights - Octet Design
- AI Tools for Data Visualization - ThoughtSpot
- How to Use AI for Data Visualization - Luzmo
- How to Use AI for Data Visualizations and Dashboards - GoodData
- AI Chart Generator - Piktochart
- AI Chart Generator Features - Infogram
Recommended Searches
Last updated April 8, 2025