
Unlock Your Data's Potential: AI-Powered Dashboards from SQL Views Are Here!
Discover how Artificial Intelligence is revolutionizing the way we visualize and interact with data stored in SQL views, making insights more accessible than ever.
In today's data-driven world, quickly transforming raw data into actionable insights is crucial. SQL views offer a streamlined way to access pre-defined subsets or aggregations of your data. Now, with the power of Artificial Intelligence (AI), creating dynamic and insightful dashboards directly from these SQL views has become remarkably efficient and accessible, even for individuals without deep technical SQL expertise. This guide explores how AI tools are simplifying this process, the key technologies involved, and how you can leverage them.
Key Insights: AI & SQL View Dashboards
- Natural Language Interaction: Modern AI tools allow users to generate complex SQL queries and dashboard components simply by describing their needs in plain language, democratizing data access.
- Automated Visualization & Insights: AI can automatically suggest and create appropriate charts, graphs, and key performance indicators (KPIs) based on the data within your SQL view, accelerating the path to insight.
- Real-Time & Dynamic Reporting: Many AI-powered dashboard solutions offer real-time data updates, ensuring your visualizations always reflect the latest information from your SQL views.
The Synergy of SQL Views and AI-Driven Dashboards
Before diving into how AI facilitates dashboard creation, let's understand the foundational components:
What is an SQL View?
A SQL view is essentially a saved SQL query that is treated as a virtual table. It doesn't store data itself but rather presents data from one or more underlying tables in a structured way. Views are incredibly useful for:
- Simplifying complex queries by encapsulating joins, filters, and aggregations.
- Providing a consistent data interface, abstracting underlying table structures.
- Enhancing data security by restricting access to specific columns or rows.
For example, you might create a view to show summarized sales data:
-- Example of creating a SQL View
CREATE VIEW MonthlySalesSummary AS
SELECT
    strftime('%Y-%m', OrderDate) AS SalesMonth,
    ProductID,
    SUM(Quantity * UnitPrice) AS TotalRevenue
FROM Orders
GROUP BY
    SalesMonth,
    ProductID;
This view, MonthlySalesSummary, can then be queried like a regular table, making it an ideal source for a dashboard.
How AI Transforms Dashboard Creation from SQL Views
AI introduces several game-changing capabilities to the dashboard creation process:
Natural Language Querying (NLQ)
One of the most significant advancements is the ability for users to interact with their data using natural language. Instead of writing SQL code, you can ask questions like, "Show me the total revenue by product for the last quarter from the MonthlySalesSummary view." The AI translates this into the appropriate SQL query and fetches the data.
Automated SQL Generation and Optimization
AI tools can automatically generate efficient SQL queries tailored to your database schema and the specific SQL view you're working with. Some systems can also optimize existing queries for better performance, which is crucial for dashboards that need to display data in near real-time.
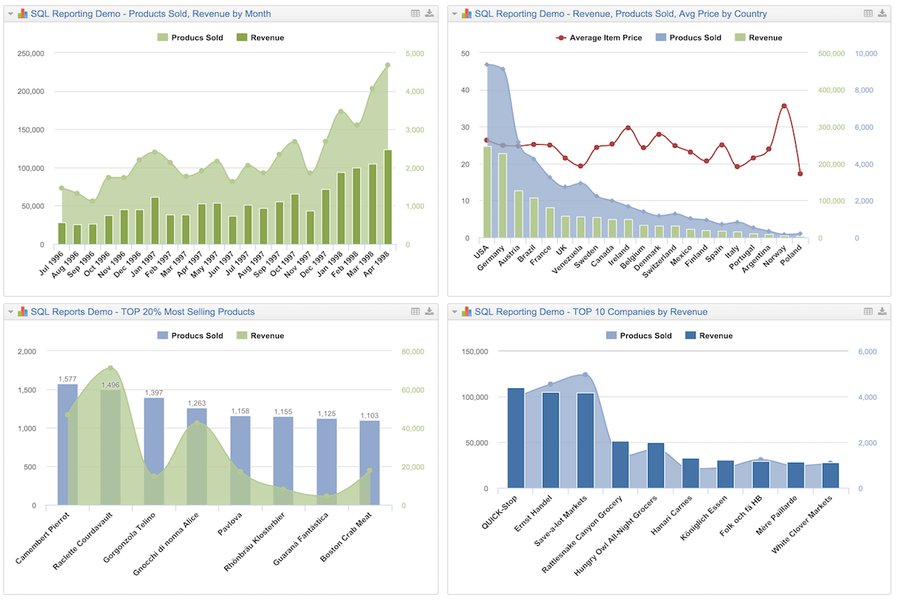
An example of an interactive SQL dashboard displaying various metrics.
Intelligent Data Visualization
AI doesn't just fetch data; it helps you understand it. Based on the characteristics of the data in your SQL view (e.g., time series, categorical, geographical), AI can suggest the most effective chart types (bar charts, line graphs, pie charts, maps, etc.). Some advanced tools can even automatically generate entire dashboards with relevant KPIs and visualizations.
Real-Time Insights and Anomaly Detection
AI-powered dashboards can connect directly to your SQL views and update in real-time or near real-time. Furthermore, AI algorithms can monitor data streams for anomalies, trends, or significant changes, alerting users to critical business events as they happen.
Reduced Technical Barriers
Collectively, these AI capabilities significantly lower the technical expertise required to create sophisticated dashboards. Business users, analysts, and executives who may not be proficient in SQL can now independently explore data and generate insights.
Leading AI Tools for SQL View Dashboarding
Several innovative platforms leverage AI to help users create dashboards from SQL views. Here are some notable examples:
| Tool Name | Key AI-Powered Features | Typical Use Case |
|---|---|---|
| Draxlr | Natural language to SQL, automated dashboard generation, real-time visualizations. | Self-serve BI for users with varying technical skills, quick dashboard creation from existing SQL views. |
| Blaze SQL AI | AI chatbot for SQL query generation, instant dashboard integration from chat prompts. | Rapid querying and visualization for non-technical users needing quick insights from SQL databases/views. |
| SQLAI.ai | AI-driven generation of SQL queries, automated chart building, and analysis hints. | Building comprehensive dashboards with AI assistance, query optimization, and reusable SQL snippets. |
| AskYourDatabase | Desktop AI SQL chatbot, natural language querying, real-time interactive dashboards, on-premise deployment options. | Business users needing to create dashboards from SQL views without coding, suitable for ad-hoc analysis. |
| Benchling Insights SQL Assistant | AI-generated SQL specifically for Benchling data warehouses, automated dashboard creation. | Specialized tool for users within the Benchling ecosystem to create dashboards from their scientific data views. |
| Reportql | AI-assisted data visualization for SQL sources, real-time dashboard building. | Users looking for an AI assistant to help visualize data from various SQL databases through views. |
These tools typically connect to a wide range of SQL databases like MySQL, PostgreSQL, SQL Server, Snowflake, and Oracle, allowing them to access and visualize data from your SQL views.
Visualizing AI's Impact on SQL Dashboard Creation
The following chart illustrates key aspects where AI significantly enhances the process of creating dashboards from SQL views. The scores (out of 10) represent the perceived level of AI contribution or improvement in each area, where a higher score indicates a greater positive impact or level of automation facilitated by AI.
This visualization highlights how AI tools generally make dashboard creation faster, more automated, and more accessible, particularly in areas like query generation and suggesting relevant visualizations, compared to traditional manual methods.
Workflow: Creating an AI-Powered Dashboard from a SQL View
While specific steps may vary depending on the chosen AI tool, a general workflow for creating a dashboard from a SQL view using AI typically involves the following stages:
This mindmap illustrates the typical journey from having a SQL view to deploying an interactive, AI-generated dashboard. The process emphasizes ease of use through natural language and automation.
Step-by-Step Breakdown:
- Prepare Your SQL View: Ensure your SQL view is well-defined in your database (e.g., MySQL, PostgreSQL, Snowflake). It should encapsulate the specific data slice you want to visualize. Optimize the view for performance, as it will be queried frequently by the dashboard.
- Select an AI Dashboard Tool: Choose an AI-powered tool that supports your SQL database and offers the features you need (e.g., natural language querying, automated visualization).
- Connect to Your Database: Use the tool's interface to securely connect to your database. You'll typically need to provide credentials, host information, and specify the database where your SQL view resides.
- Specify the SQL View and Input Requirements: Point the AI tool to your target SQL view. Then, using natural language or a guided interface, describe the dashboard you want to create. For example: "Create a dashboard showing customer demographics and purchase frequency from the 'CustomerActivityView'."
- AI Generates Queries and Visualizations: The AI engine will parse your request, generate the necessary SQL queries to retrieve data from your view, and then suggest or automatically create visual elements like charts, tables, and KPI summaries.
- Review, Customize, and Refine: The initial AI-generated dashboard serves as a strong starting point. You can then customize the layout, change chart types, adjust colors, add filters, and refine the dashboard to meet your exact specifications.
- Deploy and Share: Once satisfied, deploy the dashboard. Most tools offer options to share it with team members, embed it into other applications or websites, or set up scheduled reports.
- Monitor and Iterate: Leverage real-time data updates if available. Continuously monitor the dashboard's effectiveness and gather user feedback to make further improvements.
See AI Dashboard Creation in Action
The following video provides a demonstration of how an AI tool can be used to build a dashboard, illustrating some of the concepts discussed. While the specific tool or data source might differ, it showcases the general power and ease of using AI for dashboard development.
This video, titled "Build a Dashboard with an AI tool without Data Analysis ...", shows how AI can help in generating dashboards and SQL queries, making development faster and more efficient, even without extensive prior data analysis skills.
Best Practices for AI-Driven SQL View Dashboarding
- Ensure SQL View Optimization: Since the dashboard will query your SQL view, its performance is critical. Ensure the view is well-indexed and efficiently written.
- Clearly Define KPIs and Goals: Provide clear and specific instructions to the AI tool regarding the key metrics and business questions your dashboard should address.
- Verify Data Accuracy: While AI is powerful, always double-check the data and calculations presented on the dashboard to ensure accuracy, especially in the initial stages of using a new tool.
- Iterate Based on Feedback: Treat your first AI-generated dashboard as a starting point. Gather feedback from end-users and iterate on the design and content to improve its utility.
- Understand Security Implications: When connecting AI tools to your database, ensure you use secure connections and appropriate read-only permissions for the SQL views to protect data integrity.
Frequently Asked Questions (FAQ)
Recommended Next Steps
To delve deeper into related topics, consider exploring these queries:
- What are the best AI tools for SQL query optimization?
- How can I ensure data security when using AI tools with my databases?
- What are the natural language processing techniques used for database querying?
- How does real-time data visualization with AI enhance business intelligence?
References
Last updated May 8, 2025