
Empowering Your Project Management with AI-Driven Milestone Trend Analysis
Unlocking Predictive Insights for Project Success
In the dynamic landscape of project management, staying on track and anticipating potential delays is paramount. A powerful technique for achieving this is the Milestone Trend Analysis (MTA). The user's query specifically asks for a prompt for an AI web app builder to create an MTA tool, emphasizing data persistence and the ability to associate milestones with labels and projects. This comprehensive guide will delve into the intricacies of MTA, explore the capabilities of AI web app builders, and provide a detailed prompt to bring this vision to life.
Key Insights into Milestone Trend Analysis & AI App Building
- Milestone Trend Analysis (MTA) is a vital project management tool that visually tracks the progress of project milestones over time, revealing trends and potential deviations from the planned schedule. It helps project managers assess project health and make informed decisions.
- AI web app builders significantly accelerate development by translating natural language prompts into functional application components, enabling users without extensive coding skills to create powerful tools.
- Data persistence and clear data relationships are crucial for any effective MTA tool, allowing for historical analysis, trend identification, and accurate reporting across multiple projects and their associated milestones.
Understanding Milestone Trend Analysis (MTA)
The Essence of Project Progress Visualization
Milestone Trend Analysis (MTA) is a graphical method used in project management to monitor and visualize the deviation of project milestones over time. It's an early warning system that helps project managers identify risks and potential delays. The core concept involves regularly comparing planned and actual milestone dates and plotting them on a chart. This visual representation allows teams to see whether work corresponding to certain project milestones is ahead of, on, or behind schedule.
How MTA Charts Work
An MTA chart typically features two axes: the X-axis represents the reporting periods (when the analysis is conducted), and the Y-axis represents the milestone dates (the projected or actual completion dates). Lines are drawn for each milestone, connecting its reported dates over time. The slope of these lines provides critical insights:
- Horizontal Line: Indicates that the project is on schedule for that specific milestone. The milestone's predicted completion date has remained consistent across reporting periods.
- Upward Trending Line: Signals that the project is experiencing delays for that milestone. The estimated completion date is shifting further into the future with each reporting period.
- Downward Trending Line: Suggests that the project is ahead of schedule for that milestone. The estimated completion date is being brought forward.
By observing these trends, project managers can proactively address issues, reallocate resources, and adjust plans to mitigate risks and ensure timely delivery. It's a powerful communication tool, raising awareness of deadlines among all project participants.
Why MTA is Indispensable for Projects
The importance of MTA lies in its ability to provide a clear, visual snapshot of project health. Instead of blindly moving forward, teams can:
- Visualize Progress: Instantly see what is and is not working.
- Identify Bottlenecks: Pinpoint constraints and issues with project scope or planning early on.
- Mitigate Risks: Detect potential delays before they escalate, allowing for timely corrective actions.
- Improve Forecasting: Develop more accurate timelines based on real-time data and historical trends.
- Enhance Communication: Facilitate transparent discussions with stakeholders about project status and potential challenges.
While valuable for any project, MTA is particularly beneficial for complex, long-term initiatives where numerous interdependencies and potential for scope creep exist. For shorter, simpler projects, a less intensive tracking method might suffice, but even then, visual goals and progress data are always advantageous.
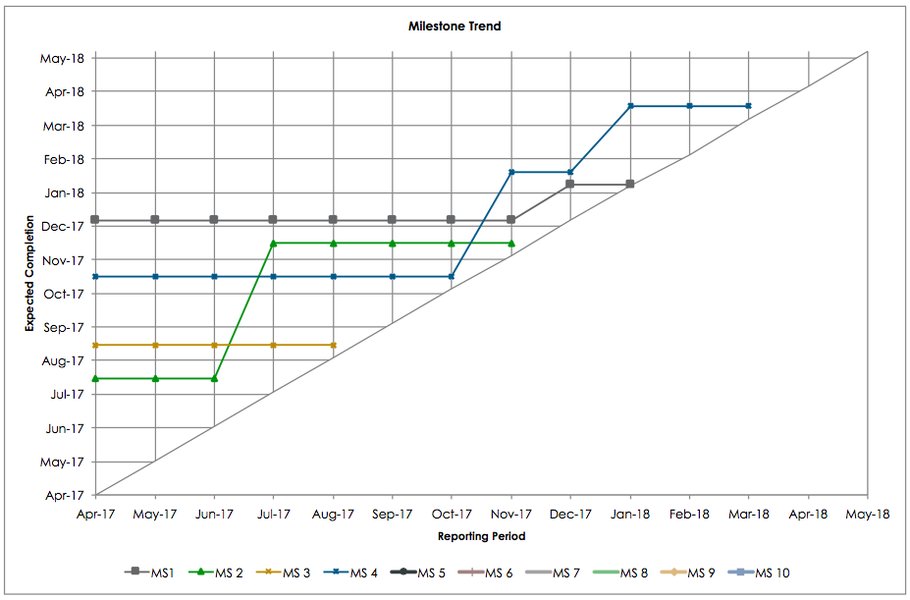
An illustrative Milestone Trend Analysis (MTA) chart showing milestone date progression over time.
The Rise of AI Web App Builders
Democratizing Application Development
AI web app builders are revolutionizing how applications are created by leveraging artificial intelligence to automate and streamline the development process. These platforms allow users to build functional web applications with minimal to no coding experience, translating natural language prompts into tangible software components. This capability significantly reduces the time and cost traditionally associated with software development.
How AI Web App Builders Function
These platforms often employ Natural Language Processing (NLP) to interpret user descriptions of desired app features. You describe what you want—for example, "a task tracker with login and analytics"—and the AI generates key components like UI designs, database structures, and workflow automations. While AI may not generate a fully functional web app from a single prompt, it provides a robust foundation, speeding up the initial build and allowing for easier iteration.
For individuals or businesses looking to quickly deploy custom solutions without hiring extensive development teams, AI web app builders offer an attractive alternative. They provide an intuitive interface, often with drag-and-drop functionalities and pre-built templates, making the process accessible to a wider audience.
A video discussing the capabilities and benefits of an AI web app builder.
This video highlights how AI web app builders can translate natural language into functional applications, emphasizing speed and ease of use. It's particularly relevant to the user's request as it demonstrates the core concept of using AI to build a customized tool, which aligns perfectly with creating a specific MTA application.
Leading AI Web App Builder Features
When considering an AI web app builder for an MTA tool, look for platforms that offer:
- Natural Language to App Generation: The ability to interpret detailed prompts and generate UI, data models, and workflows.
- Database Integration: Essential for persisting milestone data, project details, and reporting history.
- Customizable Workflows: To define how milestones are tracked, updated, and associated with projects.
- Reporting and Dashboarding: For visualizing the MTA chart and other relevant project metrics.
- Collaboration Tools: To enable team members to update milestone statuses and project details.
- Scalability: The ability to handle increasing amounts of data and users as your projects grow.
Crafting the AI Web App Builder Prompt for MTA
Designing Your Intelligent Project Tracker
The prompt needs to be highly specific, guiding the AI to build a tool that not only displays MTA but also manages the underlying data effectively. The key elements are the persistence of data in a database and the association of milestones with labels (titles) and projects.
The Comprehensive Prompt
Here's a detailed prompt designed for an AI web app builder to create a Milestone Trend Analysis (MTA) tool:
"Create a web application for project management, specifically focusing on Milestone Trend Analysis (MTA). **Core Functionality:** 1. **Milestone Management:** Allow users to define and manage individual project milestones. 2. **Project Association:** Enable each milestone to be clearly associated with a specific project. 3. **Date Tracking:** Record planned and actual (or forecasted) completion dates for each milestone over time. 4. **Milestone Trend Analysis Chart:** Generate an interactive MTA chart for each project, visualizing the trend of milestone dates. 5. **Data Persistence:** All project and milestone data must be stored in a persistent database. **Database Schema & Relationships:** * **Projects Table:** * <code>ProjectID(Primary Key, unique identifier) *ProjectName(Text, required, e.g., "New Product Launch") *ProjectDescription(Text, optional) *StartDate(Date) *EndDate(Date) * **Milestones Table:** *MilestoneID(Primary Key, unique identifier) *ProjectID(Foreign Key, links to Projects.ProjectID) *MilestoneLabel(Text, required, e.g., "Design Complete", "Alpha Release") *InitialPlannedDate(Date, the very first planned date for this milestone) *CurrentPlannedDate(Date, the most recently updated planned date) *ActualCompletionDate(Date, optional, set when milestone is completed) *IsCompleted(Boolean, default False) * **MilestoneSnapshots Table (for MTA history):** *SnapshotID(Primary Key, unique identifier) *MilestoneID(Foreign Key, links to Milestones.MilestoneID) *SnapshotDate(Date, the date when this snapshot was taken, e.g., "2025-05-21") *ReportedPlannedDate(Date, the planned date for this milestone as of theSnapshotDate) **User Interface (UI) Requirements:** * **Dashboard View:** A clean dashboard displaying a list of projects. Each project should have a quick overview of its status. * **Project Detail View:** When a project is selected, display its associated milestones in a list. * **Milestone Entry Form:** A user-friendly form to add new milestones, including associating them with an existing project, defining aMilestoneLabel, and setting anInitialPlannedDate. * **Milestone Update Functionality:** Allow users to update a milestone'sCurrentPlannedDate,ActualCompletionDate, andIsCompletedstatus. * **MTA Chart Display:** On the Project Detail View, display the Milestone Trend Analysis chart. * X-axis:SnapshotDate(Reporting Periods). * Y-axis:ReportedPlannedDate(Milestone Dates). * Each line on the chart represents a uniqueMilestoneLabelwithin that project. * Visually indicate if a milestone is completed on the chart (e.g., a distinct marker or line style). * **Reporting Period Trigger:** Provide a clear mechanism (e.g., a "Generate Snapshot" button) to record theCurrentPlannedDateof all active milestones in theMilestoneSnapshotstable for the currentSnapshotDate. This action should happen periodically, e.g., weekly or bi-weekly. **Additional Considerations:** * **User Authentication:** (Optional, but recommended for production) Implement basic user login. * **Responsiveness:** The application should be responsive and accessible on various devices. * **Error Handling:** Implement basic validation for date entries and required fields. * **Visual Appeal:** Strive for a clean, intuitive, and modern design. * **Language:** The application should be built in English."
Breaking Down the Prompt
This prompt is designed to be comprehensive, covering functional, data, and UI aspects:
- Core Functionality: Clearly outlines the primary actions the application should perform, from managing milestones to generating the MTA chart.
- Database Schema & Relationships: This is crucial for data persistence and integrity. By defining tables (
Projects,Milestones,MilestoneSnapshots) and their relationships (ProjectID,MilestoneID), the AI understands how to structure the backend. TheMilestoneSnapshotstable is key to historical tracking for MTA. - User Interface (UI) Requirements: Details the user experience, ensuring that the necessary views and interaction points are present for effective use, especially the visualization of the MTA chart itself.
- Reporting Period Trigger: This specific requirement ensures that the historical data for the MTA chart is captured systematically.
- Additional Considerations: Covers important non-functional requirements like security, responsiveness, and usability.
Visualizing Project Health with a Radar Chart
Assessing Project Maturity and Control
While the Milestone Trend Analysis chart is a line graph, a radar chart can offer a complementary high-level view of a project's overall "health" or maturity in different project management dimensions, including milestone tracking effectiveness. This helps to visualize how well various aspects of project control are being managed, providing a different perspective than the time-series data of MTA.
Radar Chart: Project Health Assessment
Below is a radar chart that assesses the effectiveness of project management in relation to milestones and overall control. Each axis represents a key aspect of project health, and the plotted values indicate the perceived strength or maturity in that area (on a scale, for example, from 1 to 10, where higher is better).
This radar chart illustrates the "Current Project Health" compared to a "Target Project Health" across several key project management dimensions. For instance, 'Milestone Adherence' measures how well milestones are met on time, directly relating to the MTA. 'Risk Identification' and 'Scope Control' highlight the proactive measures taken, which MTA helps to inform by revealing negative trends early. 'Data Accuracy' is crucial for both MTA and overall project reporting. A balanced and higher scoring polygon indicates a healthier, more controlled project environment, suggesting that the team is not only tracking milestones but also effectively managing the factors that influence them.
Essential Tools for Milestone Tracking
Software Solutions for Effective Project Oversight
While an AI web app builder can create a tailored MTA tool, numerous existing software solutions offer robust milestone tracking capabilities, often as part of broader project management suites. These tools streamline the process of defining, tracking, and reporting on project milestones.
Key Features to Look For in Milestone Tracking Software
When selecting a tool, consider features that go beyond simple task lists to provide deep insights into project progress:
- Gantt Charts: Visually represent project timelines, tasks, and milestones with dependencies. Many tools, like GanttPRO and Nifty, excel here.
- Real-time Visibility: Instant updates on milestone status, highlighting advancements and identifying bottlenecks. Striven is noted for this.
- Customizable Dashboards: Provide an overview of project status, key metrics, and milestone progress.
- Automated Reporting: Generate dynamic reports on project processes, including milestone achievements and deviations.
- Integration Capabilities: Connect with other productivity tools (e.g., Google Docs, Calendar) to keep teams aligned.
- Collaboration Features: Facilitate communication and task assignment among team members related to milestones.
- Milestone Trend Analysis (MTA) Specific Features: Some tools offer built-in MTA charts or integrate with Power BI visuals for this purpose.
Comparing Popular Milestone Tracking Software
Here's a table comparing some popular project management tools known for their milestone tracking capabilities, highlighting their strengths in relation to the features discussed:
| Software | Primary Focus | Milestone Tracking Capability | Key Differentiator (for MTA) |
|---|---|---|---|
| ClickUp | All-in-one productivity | Robust within Tasks feature, automated reporting | Comprehensive feature set for various project needs, strong integrations |
| GanttPRO | Gantt charts & project planning | Powerful milestone tool with dependencies | Excellent visual planning and tracking, clearly displays milestones |
| Wrike | Work management for enterprises | Organizes goals & milestones, integrates with tasks, offers MTA insights | Strong for complex projects, deep analytics, and workload management |
| Hubstaff Tasks | Project management & time tracking | Tagging & tracking milestones, Kanban & timeline views | Seamless integration with workforce management and productivity insights |
| Nifty | Collaboration & task management | Gantt chart, discussions, document management | Streamlined teamwork and task management, strong visual timelines |
| Striven | Business Management Suite | Real-time visibility into milestone status | Identifies bottlenecks early, offers progress monitoring |
| Milestone Planner | Dedicated milestone planning | Focuses entirely on larger planning process | Simplicity and straightforwardness for milestone-centric planning |
| OpenProject | Open-source project management | Flexible, advanced encryption, Gantt charts | Data security and adaptability for various methodologies |
Many of these tools, while not explicitly branded as "MTA software," provide the foundational capabilities to implement and analyze milestone trends. The integration of a dedicated MTA chart, however, often requires specific add-ons (like those for Power BI) or custom development, which is where the AI web app builder becomes a powerful asset for tailored solutions.
Future Outlook: AI in Project Management
Beyond Trend Analysis: Predictive Power and Automation
The integration of AI into project management, as exemplified by the use of AI web app builders, is just the beginning. AI's capacity to process vast amounts of data and identify patterns can transform how projects are planned, executed, and controlled.
- Predictive Analytics: AI can analyze historical project data, including past milestone trends, to predict future delays or cost overruns with higher accuracy. This moves beyond simply identifying current trends to forecasting potential issues before they even appear as trends.
- Automated Planning: AI can assist in generating initial project schedules and milestone plans based on project scope, resource availability, and historical performance data. Tools like Microsoft Copilot are already showing capabilities in this area.
- Resource Optimization: AI can recommend optimal resource allocation based on project demands and individual team member availability and skill sets, further supporting timely milestone completion.
- Risk Management: AI can identify potential risks by analyzing various project parameters and external factors, suggesting mitigation strategies to keep milestones on track.
- Adaptive Methodologies: AI can help teams adapt to changes by re-evaluating project timelines and milestone dependencies in real-time, providing agile responses to unforeseen challenges.
The development of custom applications using AI web app builders represents a significant step towards more intelligent, adaptive, and proactive project management. As AI capabilities advance, we can expect even more sophisticated tools that not only track progress but actively guide projects toward successful completion.
Frequently Asked Questions (FAQ)
Conclusion
Developing a custom Milestone Trend Analysis tool using an AI web app builder offers a powerful and efficient way to enhance project oversight. By leveraging a comprehensive prompt that outlines the desired functionality, database structure, and user interface, you can guide the AI to create an application tailored to your specific project management needs. The ability to persist data, associate milestones with projects and labels, and visualize trends will provide invaluable insights, empowering you to anticipate challenges, make data-driven decisions, and ultimately steer your projects towards successful completion. The future of project management is undoubtedly intertwined with intelligent automation, and custom AI-driven tools are at the forefront of this evolution.
Recommended Further Exploration
- How to implement advanced project risk management using AI
- Best practices for defining project milestones and deliverables
- Integrating AI-powered predictive analytics in project scheduling
- Exploring no-code/low-code platforms for custom business applications
References
Last updated May 21, 2025