
Unlocking AI Chart Insights: A Prompt for Pinpointing Stop-Loss Levels Without Advanced Data
Guiding your limited AI to identify robust support zones purely from visual chart data for safer long trades.
Crafting the right instructions for an Artificial Intelligence, especially one with significant limitations like no backtesting capabilities or access to external market data, can be a nuanced task. When the goal is to analyze a price chart and identify potential stop-loss levels, the prompt must be meticulously designed to leverage the AI's strengths (pattern recognition on provided data) while strictly avoiding its weaknesses. This guide provides a comprehensive prompt and explains its structure to help you elicit the most useful possible information from your AI.
Highlights: Key Takeaways for Effective Prompting
- Precision in Constraints: The prompt must explicitly forbid the AI from accessing external data, performing backtests, or engaging in risk modeling, focusing it solely on the provided chart.
- Visual Cue Guidance: Direct the AI to look for specific, visually identifiable chart patterns like support levels, swing lows, and areas of price consolidation to determine potential stop-loss points.
- Structured Output with Rationale: Requiring a clear output format, including the identified price levels and the reasoning behind each, helps to mitigate low-quality responses and allows for better assessment of the AI's analysis.
Understanding the Challenge: Prompting a Constrained AI
Your AI operates under a specific set of limitations: it cannot perform backtesting, engage in risk modeling, access external price or market data, and is prone to producing low-quality output. Furthermore, its analysis must be based *exclusively* on the price chart you provide, which may be a simple price line or a candlestick chart. The objective is to guide this AI to suggest two price levels below the current market price that would serve as robust stop-loss points for a long trade, with the lowest likelihood of being prematurely triggered. This requires a prompt that is both highly specific in its instructions and acutely aware of the AI's boundaries.
Crafting the Optimal Prompt for Chart Analysis
Below is a meticulously structured prompt designed to guide your AI. It emphasizes adherence to constraints and focuses on extracting insights purely from visual chart data.
The Core Prompt Structure
You can provide the following prompt directly to your AI:
You are tasked with analyzing a provided price chart to identify two potential stop-loss levels for a hypothetical long trade. Your analysis must be based *solely* on the visual information present in this chart.

**Section 1: Your Objective & Context**
1.  Carefully examine the price chart I provide (this may be a line chart or a candlestick chart, containing only price data).
2.  Identify the current price as displayed on the chart.
3.  Based *only* on the visual patterns and price action within this chart, determine two distinct price levels *below* the current price.
4.  These two levels should be suggested as potential stop-loss placements for a long trade, chosen because they appear to have the lowest likelihood of being triggered by normal price fluctuations, according to the chart's historical representation.

**Section 2: Strict Operational Constraints**
*   **Chart Data Only:** You MUST NOT use any external market data, news, economic indicators, or any information outside of the provided price chart. Your entire analysis is confined to the visual data within this specific chart.
*   **No Backtesting or Predictive Modeling:** You CANNOT perform any backtesting of strategies, statistical analysis, or any form of risk modeling or future price prediction.
*   **Visual Analysis Focus:** Rely strictly on observable technical levels and patterns derived directly from the price data as presented in the chart. If it's a candlestick chart, you can consider information from wicks, bodies, and candle formations as part of the visual data.

**Section 3: Analytical Guidance – What to Look For**
Focus your visual analysis on identifying features such as:
*   **Recent Swing Lows:** Significant low points from which the price has previously reversed upwards.
*   **Established Support Zones:** Price areas where the chart shows the price has historically found support or bounced multiple times.
*   **Areas of Prior Consolidation:** Ranges where the price has traded sideways for a period, potentially forming a base.
*   **Significant Historical Lows:** Key low points visible on the chart that acted as a floor for price.
*   **Price Clusters:** Levels where multiple price lows (or long lower wicks on candlesticks) have congregated.
*   **Visibly Strong Candlestick Formations (if applicable):** Patterns that traditionally indicate support or buying interest at certain levels.

**Section 4: Required Output Format**
Please structure your response as follows:

    Current Price (as identified from the provided chart): [State the current price here]

    Suggested Stop-Loss Level 1: [Specify the exact price level]
    Rationale: [Provide a brief explanation, based *only* on visual chart patterns (e.g., "This level aligns with a clear support zone observed between [date/time X] and [date/time Y] where price bounced three times," or "This level is just below a recent significant swing low formed on [date/time Z]").]

    Suggested Stop-Loss Level 2 (further below Current Price and Level 1): [Specify the exact price level]
    Rationale: [Provide a brief explanation, based *only* on visual chart patterns, for why this second, deeper level is also a strong candidate and less likely to be triggered.]

    Overall Reasoning Summary: [Briefly summarize why these two specific levels, based purely on the visual interpretation of the provided chart, are considered to have a lower likelihood of triggering a stop-loss compared to other potential levels.]

**Section 5: Final Reminder**
Remember, your suggestions and reasoning must be derived *entirely* from the visual data within the price chart I provide. Do not speculate or make assumptions beyond what is visibly evident in the chart. The quality of your analysis depends on your adherence to these instructions.
Deconstructing the Prompt: Why It Works
This prompt is engineered to navigate the AI's limitations effectively:
Focus on Visual Chart Data Only
The repeated emphasis on using *only* the provided chart data (e.g., "Based *only* on the visual patterns," "Your entire analysis is confined to the visual data") is critical. This prevents the AI from attempting to access external information it doesn't have or hallucinating data points.
Explicitly Stating Limitations
By clearly listing what the AI *cannot* do ("NO external market data," "CANNOT perform any backtesting"), the prompt sets firm boundaries. This helps in managing the AI's operational scope and reduces the likelihood of it attempting tasks beyond its capabilities, which could lead to errors or irrelevant output.
Guiding Visual Analysis
Instead of asking for a vague analysis, the prompt suggests specific visual cues (Section 3: Analytical Guidance) like "Recent Swing Lows," "Established Support Zones," and "Price Clusters." This directs the AI’s attention to common technical analysis concepts that can be identified visually from a price chart, even without complex calculations. The image below illustrates the types of support and resistance levels the AI would be looking for.
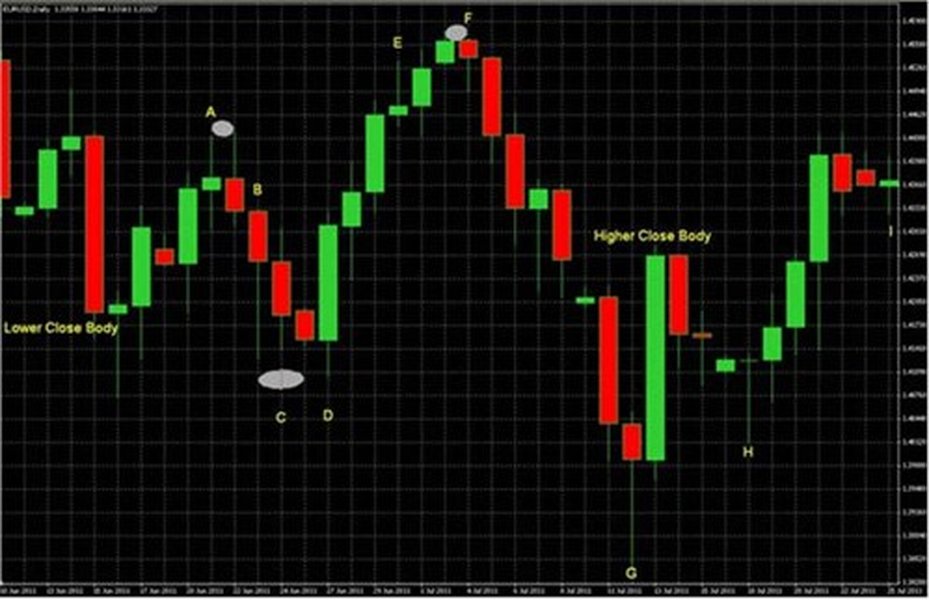
Example of support (green line) and resistance (red line) levels on a candlestick chart. The AI would look for similar historical price floors.
Structured Output for Clarity
Given the AI's propensity for low-quality output, demanding a specific output format (Section 4) is crucial. This structure forces the AI to organize its findings and provide justifications for each suggested level. This not only makes the response easier to understand but also subtly pushes the AI towards a more reasoned (even if still basic) analytical process.
Visualizing Prompt Effectiveness and AI Focus
Key Prompt Attributes for Constrained AI
A successful prompt for a limited AI balances several factors. The radar chart below visualizes the targeted attributes of our suggested prompt against potential pitfalls of a less optimized one. An ideal prompt scores highly in Clarity, Constraint Reinforcement, generating Actionable Output, maintaining Simplicity (relative to AI capability), strongly Focusing on Visuals, and providing Guidance on Reasoning. The aim is to maximize the utility of the AI's response despite its inherent limitations.
Mindmap: Connecting Prompt Elements to AI Limitations
The mindmap below illustrates how different components of the suggested prompt are designed to directly address and mitigate the AI's specific limitations. Each branch shows a core aspect of the prompt and how it guides the AI towards a more useful, constrained analysis.
(Explicitly stated in Sections 1, 2, 5)"] id2b["No Backtesting/Risk Modeling"] id2bb["Instruction: Visual pattern recognition only
(Section 2, Section 3)"] id2bc["Instruction: Qualitative reasoning, not quantitative assessment"] id2c["Prone to Low Quality Output"] id2ca["Requirement: Structured output format
(Section 4)"] id2cb["Requirement: Explicit reasoning for each level
(Section 4)"] id3["Guidance for AI's Visual Analysis"] id3a["Focus on Observable Chart Features (Section 3)"] id3aa["Support Levels / Zones"] id3ab["Swing Lows / Significant Historical Lows"] id3ac["Price Consolidation / Clusters"] id3ad["Candlestick Formations (if applicable)"] id4["Desired Output Components (Section 4)"] id4a["Current Price (identified from chart)"] id4b["Stop-Loss Level 1 + Detailed Rationale"] id4c["Stop-Loss Level 2 + Detailed Rationale"] id4d["Overall Reasoning Summary"]
Illustrating Chart-Based Stop-Loss Concepts
The AI, guided by the prompt, will attempt to identify visual cues on the chart that suggest price stability or previous buyer interest. These are areas where, historically within the context of the provided chart, downward price movement has halted or reversed. Understanding these concepts can help you interpret the AI's output.
Understanding Support Levels
Support levels are historical price points where falling prices have tended to stop and reverse upwards. These levels indicate a concentration of demand or buying interest. The AI will look for horizontal lines or zones where the price has "bounced" off multiple times. For a long trade, placing a stop-loss just below a strong support level is a common strategy, as a break below this level might indicate a significant change in market sentiment.
Identifying Potential Stop-Loss Zones
When the AI identifies potential stop-loss levels, it's essentially pointing out these zones of potential support. The image below shows an example of how a stop-loss might be placed in relation to a support level. The AI is being asked to find such plausible locations based purely on the chart's visual history.
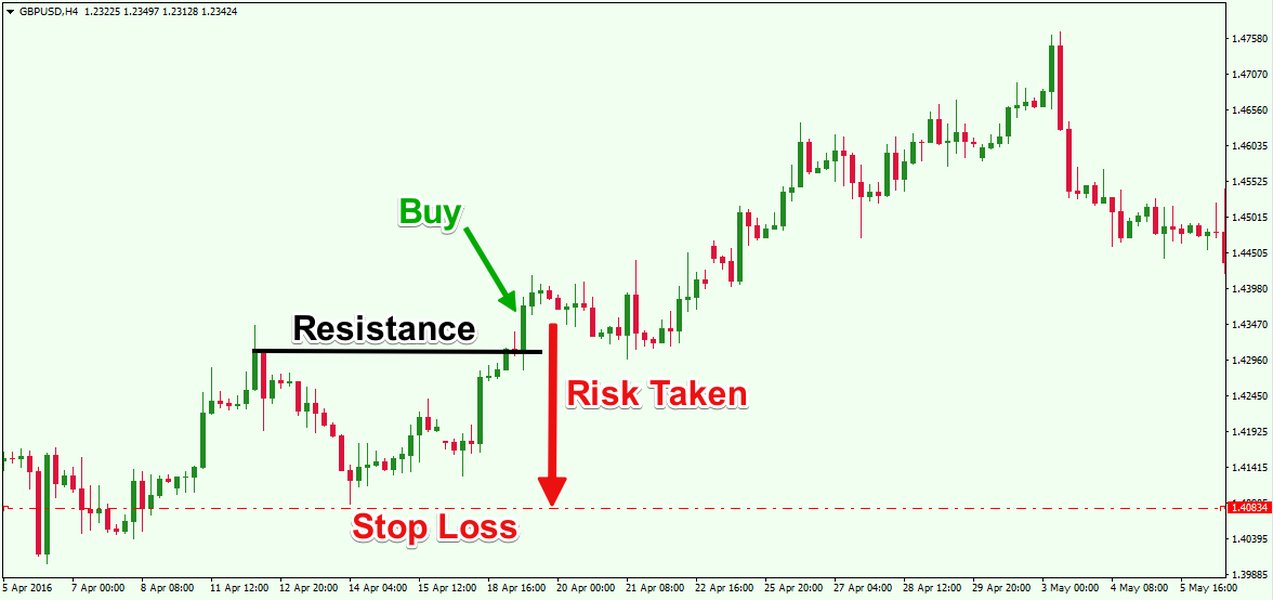
Illustrative example of a stop-loss order (red dashed line) set below a recognized support area (blue line) for a long position.
Practical Application: Key Prompt Elements and Their Purpose
The table below breaks down the crucial elements of the suggested prompt, explaining their purpose in managing the AI's limitations and guiding its analysis towards relevant, chart-based insights.
| Prompt Element | Purpose for Constrained AI | Example Focus for AI Analysis (from prompt) |
|---|---|---|
| Clear Objective Definition (Section 1) | Defines the task scope precisely, preventing the AI from guessing or deviating to unrelated analyses. | "Determine two distinct price levels *below* the current price... as potential stop-loss placements." |
| Strict Data Constraint (Chart Only) (Section 2, 5) | Prevents the AI from attempting to use external data it cannot access, which could lead to errors or fabricated information. | "You MUST NOT use any external market data... Your entire analysis is confined to the visual data within this specific chart." |
| Prohibition of Complex Tasks (Section 2) | Avoids requests for backtesting, risk modeling, or predictions that are beyond the AI's capabilities. | "You CANNOT perform any backtesting of strategies, statistical analysis, or any form of risk modeling..." |
| Visual Cue Guidance (Section 3) | Directs the AI to focus on identifiable chart features that are relevant for support/resistance analysis without requiring calculations. | "Focus your visual analysis on identifying features such as: Recent Swing Lows, Established Support Zones..." |
| Structured Output Requirement (Section 4) | Improves the clarity, consistency, and evaluability of the AI's response, especially given its propensity for lower quality output. | "Current Price: [Value] Suggested Stop-Loss Level 1: [Price] Rationale: [Explanation]" |
| Mandatory Reasoning (Section 4) | Forces the AI to articulate the basis for its choices, allowing you to assess the (visual) logic and identify potential flaws in its interpretation. | "Provide a brief explanation, based *only* on visual chart patterns..." and "Overall Reasoning Summary..." |
Further Insights: AI in Trading Analysis
Artificial intelligence is increasingly being explored for various aspects of financial market analysis. While your specific AI has limitations, understanding the broader context can be useful. Many AI tools aim to process vast amounts of data, identify patterns, and even automate trading decisions. The video below discusses general approaches to using AI for chart analysis, offering a glimpse into what more advanced systems might do. However, always remember your AI's specific constraints when interpreting its output.
This video explores general concepts of using AI in chart analysis. Note that its capabilities may differ significantly from your constrained AI.
The key with your AI is to leverage its pattern recognition on the visual data you provide, without expecting predictive accuracy or market-aware insights that require external data or complex modeling.
Tips for Maximizing Prompt Success
- Provide Clear Chart Data: If you are describing the chart in text, be as specific as possible about price points, dates/times for key features, and the nature of candlestick patterns if relevant. The more detail the AI has from *your input*, the better it can (theoretically) analyze.
- Manage Expectations: Given the AI's limitations (especially being "prone to low quality"), treat its output as a preliminary, purely visual interpretation. It's a tool for generating ideas based on chart patterns, not a definitive financial advisor.
- Iterate if Necessary: If the first response is too vague, you might slightly rephrase parts of the prompt or provide more focused details about a section of the chart. However, always stay within the AI's known constraints.
- Cross-Verify Manually: Always use your own judgment and charting skills to evaluate the AI's suggestions. Look at the chart yourself to see if the AI's "reasoning" aligns with visible patterns.
- Focus on the "Why": The AI's reasoning for choosing a level is often more insightful than the level itself. It reveals what patterns the AI prioritized, which can help you understand its interpretation process.
Frequently Asked Questions (FAQ)
Recommended Further Exploration
To deepen your understanding of related concepts, you might find these queries useful:
- How to identify strong support and resistance levels on candlestick charts.
- What are common mistakes to avoid when setting stop-loss orders based on technical analysis.
- Techniques for improving AI prompt engineering for financial chart analysis.
- Limitations of using AI for trading without access to real-time market data.
References
The insights and prompt structures discussed are informed by general principles of AI prompting and technical analysis. For further reading on related topics, consider these resources:
Last updated May 19, 2025