
Unlock Dynamic Data Insights: Dive Deep into AppSheet's Enhanced Filter Dashboards!
Transform your AppSheet applications with powerful, customizable, and user-centric data filtering capabilities.
Essential Insights: Key Takeaways
- Unmatched Customization: Enhanced filter dashboards allow for highly tailored filtering logic, going far beyond standard interactive dashboard capabilities in AppSheet.
- Dynamic User Interaction: Users can input specific criteria through dedicated controls, leading to real-time updates in displayed data across multiple views.
- User-Centric Design: These dashboards can be designed to provide personalized data views, with filters adapting to individual user roles, preferences, or specific records assigned to them.
What Exactly is an AppSheet Enhanced Filter Dashboard?
An AppSheet Enhanced Filter Dashboard represents a significant step up from the platform's standard interactive dashboards. While basic interactive dashboards allow views to filter each other based on selections (often through Ref column relationships), an enhanced filter dashboard is a more sophisticated, often manually constructed system. It provides developers with granular control over how users interact with and filter data, enabling complex, multi-faceted, and dynamic data exploration.
These dashboards are characterized by their use of dedicated filter tables, powerful slice configurations, and custom actions to create a highly responsive and tailored user experience. Instead of just clicking on an item in one view to filter another, users can typically input values, select from dropdowns, or toggle options in a specific "control" area of the dashboard, with the rest of the dashboard views updating instantly to reflect these precise criteria. This approach is ideal for applications requiring nuanced data analysis, user-specific views, or intricate filtering combinations that standard features might not easily accommodate.
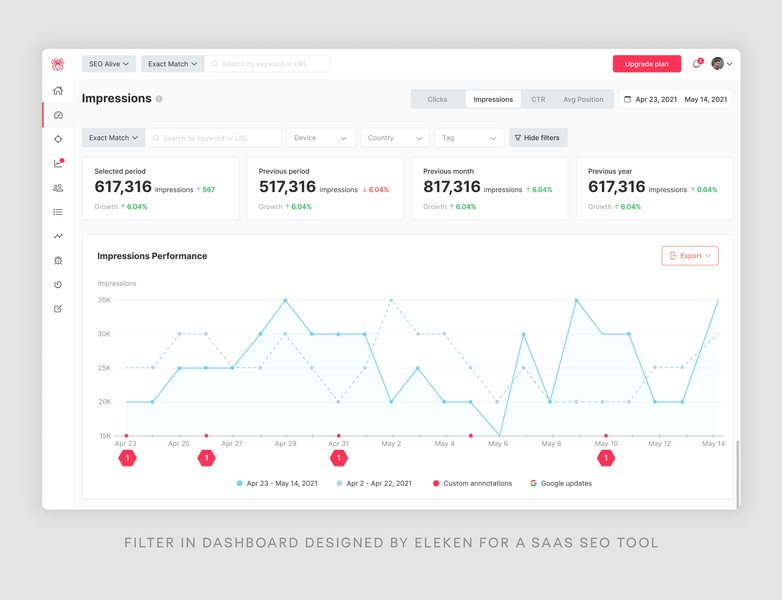
Visual representation of various filter UI elements that can be part of an enhanced dashboard design.
The Anatomy of an Enhanced Filter Dashboard
Building an effective enhanced filter dashboard in AppSheet involves understanding and skillfully combining several key components. Each plays a crucial role in delivering the dynamic and customized filtering experience.
1. The Filter Table (Control Table)
Purpose and Structure
At the heart of most enhanced filter dashboards is a dedicated table, often called a "Filter Table," "Control Table," or "User Settings Table." This table's primary purpose is to store the filter criteria entered or selected by the user. It typically has a very specific structure:
- It might contain just a single row, especially if the filters are global or session-based.
- More commonly, for personalized experiences, it contains one row per user, often keyed by `USEREMAIL()`. This allows each user to have their own set of persistent or temporary filter settings.
- Columns in this table represent the different filterable attributes (e.g., "SelectedStatus," "StartDate," "Category," "AssignedTo"). Users interact with these columns, usually through a form or quick-edit view on the dashboard.
2. Slices: The Engine of Dynamic Filtering
How Slices Power the Dashboard
Slices are arguably the most critical component for enabling dynamic filtering. A slice is a filtered subset of a table's data. In an enhanced filter dashboard, you create slices based on your main data table(s), and their filter conditions dynamically reference the values stored in the Filter Table.
For example, a slice on a "Tasks" table might have a row filter condition like:
AND(
    ISBLANK(LOOKUP(USEREMAIL(), "FilterTable", "UserEmail", "SelectedStatus")) OR ([Status] = LOOKUP(USEREMAIL(), "FilterTable", "UserEmail", "SelectedStatus")),
    ISBLANK(LOOKUP(USEREMAIL(), "FilterTable", "UserEmail", "MinDueDate")) OR ([Due Date] >= LOOKUP(USEREMAIL(), "FilterTable", "UserEmail", "MinDueDate"))
)
This expression checks the current user's filter settings in the "FilterTable" and applies them to the "Tasks" data. If a filter field in "FilterTable" is blank, that part of the condition is often designed to be ignored, effectively showing all data for that criterion.
3. Dashboard Views and Layout
Combining Controls and Results
The dashboard view itself is the canvas where these components come together. It typically consists of several interactive sub-views:
- Control View: A detail view (often with quick-edit columns) or a form view linked to the user's specific row in the Filter Table. This is where users input their filter criteria.
- Data Views: Multiple views (tables, decks, galleries, charts, maps) that display data from the dynamically filtered slices. As the user changes values in the Control View, these Data Views update in real-time.
AppSheet's "interactive mode" for dashboards can further enhance this by allowing selections in one data view to influence others, although the primary filtering is driven by the Filter Table and Slices.
4. Actions for Enhanced User Control
Simplifying Interaction
Actions add a layer of user-friendliness and control. Common actions include:
- "Clear Filters": An action that sets all the filter columns in the user's Filter Table row back to blank or default values. This is crucial for usability, preventing users from having to manually clear each filter field.
- "Save Filter Set": More advanced implementations might allow users to save and recall common filter combinations.
- Navigation Actions: Actions that navigate the user to specific views or apply predefined filter settings.
Visualizing the Connections: Enhanced Filter Dashboard Components
To better understand how these components interact, consider the following mindmap. It illustrates the relationships and flow of information within an AppSheet Enhanced Filter Dashboard architecture.
This mindmap highlights the central role of the Filter Table in capturing user intent, Slices in processing that intent against the data, and the Dashboard View in presenting the interactive results, all enhanced by user-friendly Actions.
Building Your Own: A Step-by-Step Guide
Creating an enhanced filter dashboard in AppSheet, while powerful, requires a methodical approach. Here’s a general guide to get you started, often referencing templates like the "Manual-Version-of-Interactive-Dashboard" for practical examples:
Step 1: Define and Prepare Your Data Tables
First, ensure your main data table (e.g., "Projects," "SalesRecords") is well-structured. Then, create your "Filter Table." For user-specific filtering, a key column in this table should uniquely identify the user (e.g., "UserEmail" with an initial value of `USEREMAIL()`). Add columns for each criterion users will filter by (e.g., "StatusFilter," "DateFromFilter," "CategoryFilter").
Step 2: Create Slices with Dynamic Filter Expressions
This is where the magic happens. For your main data table, create a new slice. The crucial part is its "Row filter condition." This expression will use `LOOKUP()` or similar functions to read values from the current user's row in the "Filter Table" and compare them against columns in your main data table. Remember to handle cases where a filter input might be blank (typically meaning "don't filter by this criterion").
Example: If filtering "Tasks" by "Status" and "Priority" from "UserFilterSettings" table:
AND(
    OR(ISBLANK(LOOKUP(USEREMAIL(), "UserFilterSettings", "UserEmailKey", "Status")), [StatusColumn] = LOOKUP(USEREMAIL(), "UserFilterSettings", "UserEmailKey", "Status")),
    OR(ISBLANK(LOOKUP(USEREMAIL(), "UserFilterSettings", "UserEmailKey", "Priority")), [PriorityColumn] = LOOKUP(USEREMAIL(), "UserFilterSettings", "UserEmailKey", "Priority"))
)
Step 3: Set Up the Views
You'll need at least two types of views:
- Filter Control View: Create a Detail view for the "Filter Table." Configure it to show the row corresponding to the current user (its slice condition might be `[UserEmail] = USEREMAIL()`). Make the filter columns quick-editable. This view acts as the user's control panel.
- Data Display Views: Create various views (Table, Chart, Deck, etc.) based on the slice you created in Step 2. These views will automatically show the filtered data.
Step 4: Assemble the Dashboard
Create a new Dashboard view. Add your Filter Control View and your Data Display Views to this dashboard. Arrange them logically. You might place the control view at the top or side. Enable "Interactive mode" if you want selections in one of the data views to also act as filters for others, in addition to your primary filter controls.
Step 5: Add User-Friendly Actions
Create an Action (e.g., "Clear All Filters") that targets the "Filter Table." This action should use the "Set the values of some columns in this row" type to reset all filter columns in the user's filter row to blank or their default states. Display this action prominently in the Filter Control View.
Step 6: Test Thoroughly
Test the dashboard extensively. Log in as different users (if using per-user filtering) to ensure privacy and correctness. Check various filter combinations and ensure the "Clear Filters" action works as expected. Refine expressions and view configurations for optimal performance and user experience.
Unlocking the Power: Key Benefits
Implementing enhanced filter dashboards in your AppSheet applications brings a host of advantages:
- Highly Tailored User Experience: Filters can be precisely configured to match specific user roles, needs, or even individual preferences, making the app more relevant and efficient for each user.
- Dynamic Real-Time Data Views: As users adjust filter criteria, the displayed data updates instantaneously, providing immediate feedback and facilitating rapid data exploration and analysis.
- Greater Flexibility and Control: Developers have fine-grained control over the filtering logic, allowing for complex multi-field filters, conditional logic, and custom input methods that go beyond standard AppSheet capabilities.
- Improved Data-Driven Decision Making: By enabling users to easily slice and dice data from various angles, these dashboards empower them to uncover insights, spot trends, and make more informed decisions.
- Centralized Information Hubs: Dashboards can consolidate information from multiple sources, all dynamically filtered, providing a comprehensive overview tailored to the user's current focus.
- Enhanced Collaboration (with User-Specific Views): While users might share a common app, their dashboard views can be personalized, ensuring they see only the data relevant to their tasks or permissions, streamlining workflows.
Comparing Dashboard Capabilities: Standard vs. Enhanced
To better understand the value of enhanced filter dashboards, it's helpful to compare them with AppSheet's standard interactive dashboards. The following table highlights key differences:
| Feature | Standard Interactive Dashboard | Enhanced Filter Dashboard |
|---|---|---|
| Primary Mechanism | Built-in linking via Ref columns; selecting an item in one view filters another. |
Manual setup with dedicated Filter Tables, Slices using complex expressions, and control views for input. |
| Filter Complexity | Generally basic, often single-level selection based on relationships. | Can handle complex, multi-criteria, conditional logic, range selections, and more. |
| Customization Level | Limited to how views are linked and what data they show. | Highly customizable filtering logic, input methods (dropdowns, text fields, date pickers), and UI layout for controls. |
| User Specificity | Can be general, or achieve basic user role filtering through security filters on underlying tables/slices. | Designed for advanced per-user or role-specific filters, allowing personalized filter settings and views. |
| Setup Effort | Relatively lower; relies on AppSheet's built-in interactivity. | Higher; requires manual configuration of tables, slices, views, and actions. |
| Control Elements | User selections in one data view act as filters for other linked data views. | Dedicated control views or forms specifically designed for users to input and manage their filter criteria. |
| Dynamic Updates | Yes, based on selections in linked views. | Yes, highly responsive to explicit filter inputs in the control view. |
While standard interactive dashboards are excellent for simpler scenarios and quick setup, enhanced filter dashboards offer the depth and flexibility needed for more demanding data analysis applications.
Feature Comparison Radar: Enhanced vs. Standard Dashboards
This radar chart provides a visual comparison of Enhanced Filter Dashboards against Standard Interactive Dashboards across several key attributes. It helps illustrate where enhanced dashboards truly shine by offering greater capabilities, albeit with increased development effort.
As illustrated, Enhanced Filter Dashboards excel in customization, filter complexity, user control, and achieving fine data granularity. While they require more development effort, the payoff is a significantly more powerful and tailored data interaction experience.
See it in Action: Enhanced Dashboard Sample
Visual examples can often clarify complex concepts. The following video demonstrates an AppSheet sample app that showcases an enhanced dashboard. Pay attention to how user inputs in one section dynamically change the data displayed in other parts of the dashboard. This illustrates the principles of using a control area to drive filtering across various data views.
This video, "Enhanced Dashboard || Sample App," provides a practical look at how these dynamic filtering systems function within an AppSheet application.
This sample app effectively uses a "live-edit" section (the filter control area) that allows users to input criteria, and the associated display sections (charts, tables) update accordingly. This is a hallmark of a well-implemented enhanced filter dashboard, providing immediate feedback and a highly interactive data exploration tool.
Frequently Asked Questions (FAQ)
Recommended Further Exploration
- How can I implement user-specific filters in AppSheet dashboards for personalized views?
- What are the best practices for designing AppSheet slices that handle complex filtering logic effectively?
- Could you provide examples of AppSheet expressions specifically for dynamic date range filtering in a dashboard setting?
- What advanced techniques can be used to optimize the performance of AppSheet dashboards that feature multiple dynamic filters?
References
Last updated May 17, 2025