
Unlock Dynamic Data Insights: Your Ultimate Guide to AppSheet's Enhanced Filtered Dashboards!
Step-by-step instructions to build powerful, interactive dashboards that respond to your users' needs.
Creating an enhanced dashboard with dynamic filters in AppSheet allows users to interact with data more effectively, tailoring views to their specific analytical needs. This guide will walk you through the process of building such a dashboard, transforming raw data into actionable insights.

An example of how dashboards can visualize data in AppSheet.
Key Highlights for Building Your Filtered Dashboard
- Dual-Table System Foundation: Utilize a dedicated table for filter inputs (a "filter control table") alongside your main data table for robust and granular control over displayed information.
- The Power of Dynamic Slicing: Leverage AppSheet's slices, driven by powerful expressions, to create real-time, interactive data filtering that responds instantly to user selections.
- Interactive Dashboard Assembly: Combine specialized views—one for filter controls and others for data display (charts, tables)—into a cohesive and interactive dashboard view for a seamless user experience.
Step-by-Step Guide to Your Enhanced AppSheet Dashboard
Follow these steps to construct a sophisticated dashboard that empowers users with customizable data filtering capabilities.
Step 1: Preparing Your Data Foundation (Tables)
The backbone of your interactive dashboard lies in well-structured tables. You'll typically need at least two main tables:
Main Data Table
This table contains the primary data you want to display and filter. For instance, if you're tracking sales, this table would include columns like Order ID, Product, Sale Date, Amount, and Region.
- Ensure your data is clean and organized.
- Define appropriate data types for each column.
Filter Control Table
This table is specifically designed to hold the filter criteria selected by the user. It acts as a temporary storage for the user's current filter preferences. Each row in this table can represent a user's unique set of filter choices, especially if you plan for per-user filtering.
- Columns: Create columns that correspond to the fields you want to filter by in your Main Data Table (e.g.,
SelectedRegion,StartDate,EndDate,ProductCategory). - User Identification (Optional but Recommended for Per-User Filters): Include a column like
UserEmailorUserID. This allows each user to have their own persistent or session-based filter settings. If you don't need per-user filters and want a global filter control, a single-row table can suffice. - Typically, this table might only have one active row per user (or one global row) that gets updated as the user interacts with the filter controls.
Step 2: Crafting Dynamic Data Subsets (Slices)
Slices are AppSheet's way of creating filtered views of your tables without altering the original data. They are essential for making your dashboard dynamic.
User Filter Settings Slice (If implementing per-user filters)
If you've set up your Filter Control Table for per-user settings, create a slice on this table to isolate the record relevant to the currently logged-in user.
- Name: For example, "CurrentUser_FilterSettings".
- Source Table: Your Filter Control Table.
- Row Filter Condition: Use an expression like
[UserEmailColumn] = USEREMAIL(). This ensures the slice only contains the filter settings row for the active user. If you are not using per-user filters but a global filter row (e.g., identified by a specific key), your slice condition would point to that specific row.
Filtered Data Slice
This is the core slice that will display the filtered data from your Main Data Table based on the selections in the Filter Control Table (or the "CurrentUser_FilterSettings" slice).
- Name: For example, "FilteredSalesData".
- Source Table: Your Main Data Table.
- Row Filter Condition: This is where the magic happens. You'll use AppSheet expressions to compare data in the Main Data Table with the values in your Filter Control Table (or its slice). The
FILTER()function is fundamental here, though often the conditions are applied directly in the slice's row filter.Example Expression (assuming your Filter Control Table has one active row, or you are referencing a slice like "CurrentUser_FilterSettings" that resolves to one row):
AND(
  ISBLANK(ANY(SELECT(FilterControlTable[SelectedRegion], TRUE))) OR ([Region] = ANY(SELECT(FilterControlTable[SelectedRegion], TRUE))),
  ISBLANK(ANY(SELECT(FilterControlTable[StartDate], TRUE))) OR ([Sale Date] >= ANY(SELECT(FilterControlTable[StartDate], TRUE))),
  ISBLANK(ANY(SELECT(FilterControlTable[EndDate], TRUE))) OR ([Sale Date] <= ANY(SELECT(FilterControlTable[EndDate], TRUE))),
  ISBLANK(ANY(SELECT(FilterControlTable[ProductCategory], TRUE))) OR ([Category] = ANY(SELECT(FilterControlTable[ProductCategory], TRUE)))
)
This expression means: for each condition, if the filter input in the
FilterControlTableis blank, ignore this filter; otherwise, apply it. TheANY(SELECT(FilterControlTable[ColumnName], TRUE))part fetches the current filter value. If using a user-specific slice like "CurrentUser_FilterSettings", replaceFilterControlTablewithCurrentUser_FilterSettingsin the SELECT expressions.
Using ISBLANK() OR ... allows filters to be optional. If a filter field is empty, that condition is effectively bypassed.
Step 3: Designing the User Interface (Views)
With your tables and slices prepared, you can now create the views that will form your dashboard.
Filter Control View
This view allows users to input or change their filter criteria. It's based on your Filter Control Table or the "CurrentUser_FilterSettings" slice.
- View Type: Typically a "Detail" view.
- Source: Your Filter Control Table or its user-specific slice (e.g., "CurrentUser_FilterSettings"). If using a multi-row Filter Control Table without a user-specific slice that resolves to one row, you might use a Form view to create/edit filter rows, or a Table view allowing selection of a filter row. For interactive dashboards, a Detail view of a single, editable filter row is common.
- Quick Edit Columns: Enable "Quick Edit" for the columns that represent filter inputs (e.g.,
SelectedRegion,StartDate). This allows users to modify filter values directly on the dashboard. - Layout: Arrange the filter fields logically.
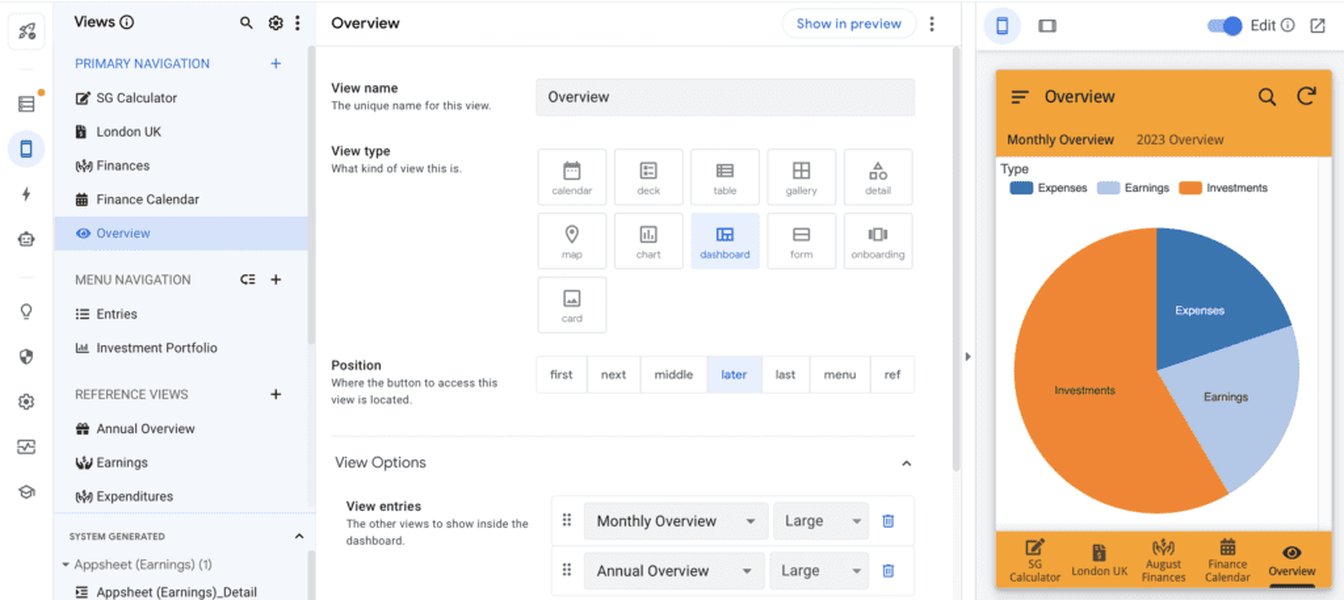
An illustration of a dashboard view layout in AppSheet, often incorporating filter controls.
Data Display Views
These views will show the data from your "Filtered Data Slice," updating dynamically as filter criteria change.
- View Types: You can create multiple views like "Table," "Deck," "Chart" (e.g., pie chart, bar graph, histogram), "Map," etc.
- Source: Your "Filtered Data Slice" (e.g., "FilteredSalesData").
- Configuration: Customize each view to best represent the filtered data. For charts, select appropriate axes and aggregation.
Step 4: Assembling Your Interactive Dashboard
Now, bring all your views together into a single dashboard interface.
- Navigate to the UX -> Views section in your AppSheet editor.
- Create a new view and set its type to "Dashboard."
- Add View Entries: Add the Filter Control View and your Data Display Views to this dashboard.
- Arrange Layout: Organize the views on the dashboard for an intuitive user experience. You can adjust their size and position. For example, place the Filter Control View at the top or side.
- Enable Interactive Mode (Crucial): In the dashboard view settings, ensure "Interactive mode" is ON (if available/needed for your specific interaction model). This setting allows selections in one view on the dashboard to potentially influence other views on the same dashboard, although the primary filtering mechanism here relies on the slices reacting to changes in the Filter Control Table. For our setup, the data views update because their underlying slice ("Filtered Data Slice") changes when the Filter Control Table is modified via the Filter Control View.
Step 5: Enhancing User Experience (Actions)
Actions can significantly improve the usability of your dashboard.
'Clear Filters' Action
Provide a simple way for users to reset all filter criteria.
- Action Type: "Data: set the values of some columns in this row."
- Target Table: Your Filter Control Table (or the "CurrentUser_FilterSettings" slice).
- Columns to Set: For each filter column in your Filter Control Table (e.g.,
SelectedRegion,StartDate), set its value to blank ("") or a default. - Display: Add this action as a button, perhaps in the Filter Control View or prominently on the dashboard.
'Apply Preset Filters' Action (Advanced)
For more complex scenarios, you might allow users to save and apply predefined sets of filters. This typically involves an additional table for storing presets and actions to copy a selected preset's values into the user's active filter row in the Filter Control Table.
Step 6: Testing, Refining, and Optimizing
Thoroughly test your dashboard to ensure it functions as expected.
- Filter Logic: Test all filter combinations. Do they correctly update the data views? Are there any errors in your slice expressions?
- User Experience: Is the dashboard intuitive? Are controls easy to find and use?
- Performance: For large datasets, complex filter expressions can impact performance. Monitor load times and optimize expressions or data structures if necessary. Consider indexing in your backend data source for columns used in filters.
- Edge Cases: What happens if no filters are applied? What if filter selections result in no data? Ensure graceful handling.
- Multi-User Testing (if applicable): If you implemented per-user filtering, test with different user accounts to confirm that filter settings are isolated.
Visualizing Dashboard Components and Effectiveness
Architectural Overview: Mindmap
This mindmap illustrates the interconnected components that form your enhanced filtered dashboard in AppSheet. Understanding this structure is key to troubleshooting and extending its functionality.
(Source of all records)"] id1b["Filter Control Table
(Stores user's filter selections, e.g., 'Users' or 'Filters' table)"] id2["Filtering Logic (Slices)"] id2a["User-Specific Filter Slice
(e.g., 'CurrentUser_FilterSettings' on Filter Control Table, filters for logged-in user)"] id2b["Filtered Data Slice
(On Main Data Table, uses expressions referencing User-Specific Filter Slice values)"] id3["User Interface (Views)"] id3a["Control View
(Detail/Form view of User-Specific Filter Slice with Quick Edit columns for filter inputs)"] id3b["Data Display Views
(Charts, Tables, Decks, etc., based on Filtered Data Slice)"] id4["Dashboard & Interactivity"] id4a["Main Dashboard View
(Combines Control View & Data Display Views)"] id4b["Real-time Updates
(Views refresh as filter criteria change)"] id4c["User Actions
(e.g., 'Clear Filters' button, 'Apply Preset Filters')"]
Comparative Analysis: Dashboard Effectiveness
The radar chart below offers a conceptual comparison between a basic AppSheet dashboard and an enhanced filtered dashboard across several key attributes. An enhanced dashboard generally offers greater customization and interactivity, which may come with increased setup complexity and potential performance considerations for very large datasets.
Key Components Summary
Understanding the role of each component is crucial for building and maintaining your enhanced filtered dashboard. The table below summarizes these key elements:
| Component | Purpose | Key Configuration / Example |
|---|---|---|
| Filter Control Table | Stores user-selected filter criteria. Often one row per user or one global row. | Columns for each filter type (e.g., Filter_Status, Filter_StartDate), optional User Email column. |
| Main Data Table | Contains the primary data to be displayed and filtered. | Relevant data fields (e.g., Sales_Amount, Project_Name, Entry_Date). |
| User Filter Slice (e.g., "CurrentUserFilters") | Isolates the current user's filter settings from the Filter Control Table (if per-user filtering is implemented). | Row Filter Condition: [UserEmail] = USEREMAIL() on Filter Control Table. |
| Filtered Data Slice (e.g., "FilteredEntries") | Filters the Main Data Table based on selections in the User Filter Slice or Filter Control Table. | Row Filter Condition: Expressions referencing values from the User Filter Slice, e.g., AND([Status]=[_THISROW_AFTER].[Filter_Status_Ref], [Date]>=[_THISROW_AFTER].[Filter_StartDate_Ref]) where _THISROW_AFTER refers to the filter control row. Or using ANY(SELECT(...)). |
| Filter Control View | Allows users to input or modify filter criteria. | Detail View of User Filter Slice, with Quick Edit enabled for filter columns. |
| Data Display View(s) | Shows the filtered data (charts, tables, decks, etc.). | Based on the Filtered Data Slice. Multiple views can be created. |
| Dashboard View | Combines the Filter Control View and Data Display View(s) into an interactive layout. | Add created views as entries. Arrange layout. "Interactive mode" can enhance behavior. |
| 'Clear Filters' Action | Resets filter criteria to their default or blank states. | Action of type "Set column values" targeting the User Filter Slice or Filter Control Table row, setting filter fields to "". |
See It in Action: Building Filtered Dashboards
Visual demonstrations can often clarify complex processes. The video below provides an example of creating dashboards in AppSheet, which can offer supplementary insights into dashboard construction concepts. While specific steps for "enhanced filtering" as detailed here might vary, understanding general dashboard assembly is beneficial.
This video, "Enhanced Dashboard || Sample App," showcases dashboard features in AppSheet.
Frequently Asked Questions (FAQ)
Recommended Next Steps
To deepen your understanding and explore related functionalities, consider these queries:
- How can I implement cascading dropdown filters in AppSheet dashboards for more dependent filtering?
- What are the best practices for optimizing AppSheet dashboard performance when dealing with very large datasets?
- How can I use AppSheet actions to navigate between different filtered views or even entirely different dashboards while preserving context?
- What are some advanced AppSheet expressions for creating complex data aggregations to display in dashboard charts?
References
For further reading and official documentation, refer to these resources:
Last updated May 17, 2025