
Exploring Association and Correlation
An Overview of Concepts, Formulas, and Visual Examples
Key Highlights
- Conceptual Distinction: Association is the broad statistical dependence between variables, while correlation specifically measures a linear relationship.
- Simple Formula & Visuals: Understand the Pearson correlation coefficient formula and visualize relationships via diagrams and charts.
- Practical Examples: Real-world examples illustrate how correlation appears in scatter plots and how non-linear association might differ.
1. Definitions and Core Concepts
Association describes a general relationship between two or more variables, indicating that changes in one variable may coincide with changes in another. It is a broad term that does not necessarily imply a linear relationship.
Correlation, on the other hand, is a specific type of association that quantifies the strength and direction of a linear relationship. It is usually measured by a correlation coefficient—most notably Pearson's correlation coefficient—which ranges from -1 to +1. A value of +1 indicates a perfect positive linear relationship, -1 represents a perfect negative relationship, and 0 implies no linear relationship.
Additionally, other methods like Spearman's rank correlation can be used if the relationship is monotonic but not strictly linear.
2. Mathematical Formula and Explanation
Pearson Correlation Coefficient
The Pearson correlation coefficient (r) is defined by the formula:
\( r = \frac{\sum_{i=1}^{n}(x_i - \bar{x})(y_i - \bar{y})}{\sqrt{\sum_{i=1}^{n}(x_i - \bar{x})^2} \sqrt{\sum_{i=1}^{n}(y_i - \bar{y})^2}} \)
In this formula, \(x_i\) and \(y_i\) represent the data points of the two variables, while \(\bar{x}\) and \(\bar{y}\) represent their respective means. The numerator calculates the covariance between variables, and the denominator standardizes the measure by scaling with the standard deviations.
3. Visualizing Association and Correlation
Scatter Plots and Diagrammatic Representations
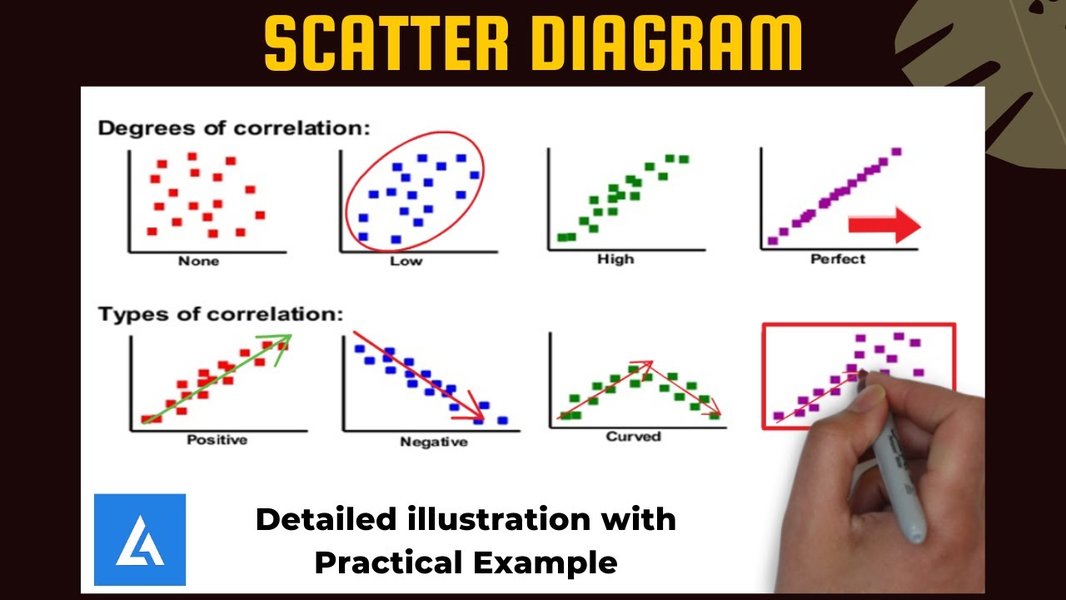
A scatter plot is typically used to illustrate the relationship between two quantitative variables. Consider the relationship between study time and exam grade:
- Strong Positive Correlation: Data points cluster along an upward-sloping line.
- Strong Negative Correlation: Data points cluster along a downward-sloping line.
- No Correlation: Data points are randomly dispersed with no clear pattern.
- Non-Linear Association: The data may show a U-shaped or inverted U-shaped pattern, indicating association without a strong linear correlation.
Radar Chart Representation
Below is a radar chart illustrating various aspects such as linearity, strength, direction, and non-linearity. While the chart is opinion-based, it summarizes key components that help compare different relationships.
Mermaid Mindmap: Overview of Concepts
The following mindmap organizes key ideas related to association and correlation:
4. PowerPoint Presentation Outline (5 Slides)
Below is a structured outline for a PowerPoint presentation that covers association and correlation:
| Slide Number | Title | Content |
|---|---|---|
| Slide 1 | Title Slide |
|
| Slide 2 | Defining Association |
|
| Slide 3 | Defining Correlation |
|
| Slide 4 | Visualizing Relationships |
|
| Slide 5 | Conclusion & References |
|
5. Additional Resources: Video Illustration
Watch the embedded video below for a detailed discussion on correlation and association concepts and examples:
FAQ Section
What is the main difference between association and correlation?
How is the Pearson correlation coefficient calculated?
Can association indicate causation?
References
- Pearson's & Statistical Measures - Nature Methods
- Statistical Dependence Discussion - Stats Exchange
- Association vs. Correlation Explained - Ledidi
- Correlation Overview - Wikipedia
- Pearson Correlation Coefficient - Statology
Recommended Queries
Last updated April 2, 2025