
Unlocking Market Volatility: What is the Average True Range (ATR) and How Can It Sharpen Your Trading Edge?
Dive into one of technical analysis's cornerstone tools for measuring price volatility and refining your trading strategies.
The Average True Range (ATR) is a widely respected technical analysis indicator developed by J. Welles Wilder Jr. and introduced in his seminal 1978 book, "New Concepts in Technical Trading Systems." Unlike many indicators that aim to predict price direction, the ATR's sole focus is to measure market volatility. Understanding an asset's volatility is crucial for traders, as it impacts risk management, position sizing, and the setting of realistic profit targets and stop-loss orders. This guide will delve into what ATR is, how it's calculated, and its practical applications in stock trading and other financial markets.
Key Insights: Mastering ATR
- Volatility, Not Direction: ATR quantifies the degree of price movement or volatility, but it does not indicate the trend or direction of the price. High ATR suggests higher volatility, while low ATR indicates lower volatility.
- Dynamic Risk Management: A primary use of ATR is to set dynamic stop-loss orders and determine appropriate position sizes that adapt to the prevailing market volatility, rather than using static, arbitrary values.
- Universal Applicability: ATR can be applied to various financial instruments, including stocks, forex, commodities, and indices, and across different timeframes, making it a versatile tool for many trading styles.
Deconstructing the Average True Range (ATR)
What Exactly is ATR?
The Average True Range (ATR) is a technical indicator that provides an objective measure of an asset's price volatility over a specified period. It essentially shows how much an asset's price has moved, on average, during that timeframe. Wilder initially designed it for commodities, which often experience gaps and limit moves, but it has since been broadly adopted across all types of securities.
A rising ATR indicates that volatility is increasing, meaning the average price range per period (e.g., day) is widening. Conversely, a falling ATR suggests that volatility is decreasing, and the average price range is narrowing. Periods of low ATR often precede significant price breakouts, as markets tend to cycle between low and high volatility phases.
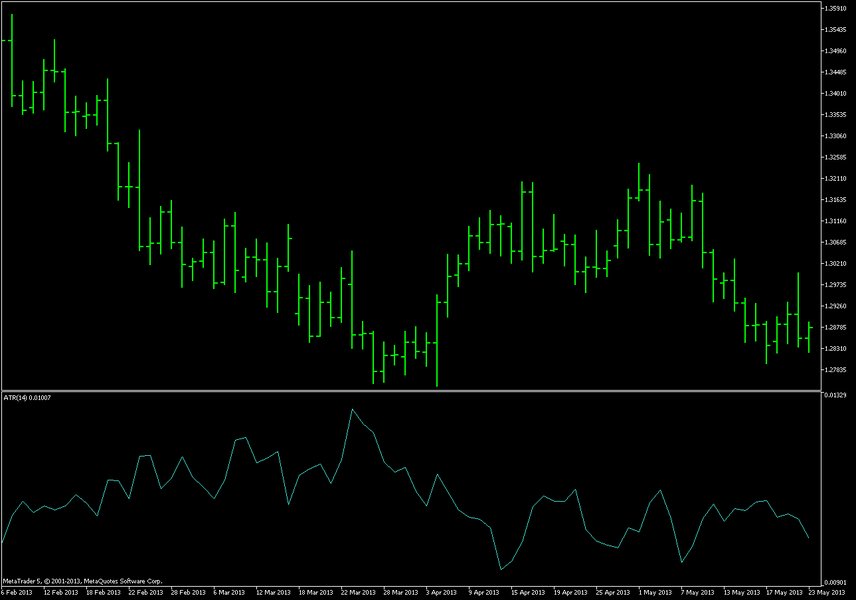
An example of the ATR indicator plotted below a candlestick price chart, showing how ATR values fluctuate with market volatility.
The Mechanics: How is ATR Calculated?
To understand ATR, one must first grasp the concept of the "True Range" (TR). The True Range for a given period aims to capture the full extent of price movement, including any price gaps that may occur between trading sessions (e.g., overnight gaps in stock prices).
Calculating the True Range (TR)
For each period, the True Range is the greatest of the following three values:
- The difference between the current period's high and the current period's low. \[ \text{TR}_1 = \text{Current High} - \text{Current Low} \]
- The absolute value of the difference between the current period's high and the previous period's close. \[ \text{TR}_2 = |\text{Current High} - \text{Previous Close}| \]
- The absolute value of the difference between the current period's low and the previous period's close. \[ \text{TR}_3 = |\text{Current Low} - \text{Previous Close}| \]
The True Range for the period is then: \( \text{TR} = \max(\text{TR}_1, \text{TR}_2, \text{TR}_3) \)
Calculating the Average True Range (ATR)
The ATR is typically calculated as a smoothed moving average of these True Range values over a specific number of periods, commonly 14 periods as suggested by Wilder. The calculation process is as follows:
- Initial ATR: For the first ATR value, calculate the simple average of the True Ranges for the chosen number of periods (N). \[ \text{Initial ATR} = \frac{1}{N} \sum_{i=1}^{N} \text{TR}_i \]
- Subsequent ATR Values: Wilder used a specific smoothing method, but a common approach for subsequent ATR values is an exponential moving average (EMA) or a variation: \[ \text{Current ATR} = \frac{(\text{Prior ATR} \times (N-1)) + \text{Current TR}}{N} \]
This formula ensures that the ATR adapts over time, giving more weight to recent volatility while still incorporating historical data.
Practical Applications: When to Deploy ATR in Your Trading
The ATR is a versatile tool that finds its place in various aspects of a trading plan. Its primary strength lies in its ability to quantify volatility, which can then be used to inform several key trading decisions.
This video, "Introduction to the Average True Range (ATR) Indicator," offers a beginner-friendly overview of what ATR measures and how it can be applied in trading. It covers the fundamental concepts and provides visual examples, making it a good starting point for understanding this essential volatility indicator.
Key Uses of ATR in Trading Strategies
The table below summarizes the most common and effective ways traders utilize the Average True Range:
| Application | Description | Benefit |
|---|---|---|
| Volatility Measurement | Provides a numerical value for the current market volatility. High ATR signifies high volatility; low ATR indicates low volatility. | Helps traders understand the market environment and adjust their strategies accordingly (e.g., expecting wider price swings in high ATR). |
| Stop-Loss Placement | Used to set dynamic stop-loss orders. A common method is to place a stop at a multiple of the ATR (e.g., 1.5x, 2x, or 3x ATR) away from the entry price. | Allows stop-losses to adapt to changing market volatility, reducing premature stop-outs during volatile periods and tightening stops in calmer markets. |
| Position Sizing | Helps determine the appropriate trade size based on account risk and current market volatility. A larger ATR might necessitate smaller position sizes to maintain consistent risk. | Enables consistent risk management across different assets and market conditions by accounting for their varying volatility levels. |
| Identifying Potential Breakouts | A sudden surge in ATR after a period of low volatility can signal increasing momentum and a potential breakout from a consolidation range. | Helps in timing entries for breakout strategies, as increased volatility often accompanies significant price moves. |
| Entry and Exit Triggers | While not directional, changes in ATR can serve as part of an entry or exit rule. For example, a price move exceeding a certain ATR multiple might trigger an entry. | Can enhance the precision of entry and exit points by confirming shifts in market volatility. |
| Adjusting Trailing Stops | ATR can be used to set trailing stops that adjust with volatility, protecting profits while allowing trades room to move. | Maximizes profit potential in trending markets by letting profits run, while still providing a volatility-adjusted safety net. |
Visualizing ATR's Utility: A Comparative Look
The ATR's utility can vary depending on a trader's style and objectives. The radar chart below provides a conceptual visualization of how different aspects of ATR might be prioritized by different types of traders. For instance, a short-term day trader might heavily rely on ATR for setting tight stops and gauging intraday volatility, while a long-term investor might use it more broadly to understand overall market character.
This chart illustrates hypothetical relative importance scores (out of 10) for different ATR applications based on trading style. It emphasizes that while ATR is universally useful, its specific application can be tailored.
ATR Conceptual Framework: A Mindmap Overview
To consolidate the understanding of the Average True Range, the following mindmap outlines its core concepts, from definition and calculation to its multifaceted uses in trading. This visual representation helps to see how different aspects of ATR interrelate.
1. Current High - Current Low
2. |Current High - Prev. Close|
3. |Current Low - Prev. Close|"] id2b["Typically a 14-period smoothed moving average of TR values"] id2c["Formula: Current ATR = [(Prior ATR * (N-1)) + Current TR] / N"] id3["Interpretation"] id3a["High ATR = High Volatility (wider price swings)"] id3b["Low ATR = Low Volatility (narrower price swings)"] id3c["Expanding ATR may signal breakouts"] id3d["Contracting ATR may indicate consolidation"] id4["Primary Uses"] id4a["Volatility Assessment
(Gauging market character)"] id4b["Stop-Loss Placement
(Dynamic, volatility-adjusted stops)"] id4c["Position Sizing
(Risk management based on volatility)"] id4d["Breakout Identification
(Confirming strength of moves)"] id4e["Entry/Exit Timing Refinement
(In conjunction with other signals)"] id4f["Adjusting Strategy Parameters
(Adapting to market conditions)"] id5["Key Characteristics"] id5a["Lagging Indicator (based on historical data)"] id5b["Versatile across markets (stocks, forex, commodities)"] id5c["Applicable on various timeframes (intraday to daily/weekly)"]
This mindmap provides a structured overview of ATR, highlighting its fundamental nature as a volatility measure and its diverse applications in practical trading scenarios.
Frequently Asked Questions (FAQ) about ATR
What is considered a "good" ATR value?
Can ATR predict the direction of a price move?
What is the standard period setting for ATR, and can it be changed?
Is ATR a leading or lagging indicator?
How is ATR different from standard deviation as a volatility measure?
Recommended Further Exploration
To deepen your understanding of volatility and related trading concepts, consider exploring these queries:
- How can I effectively combine ATR with other technical indicators for more robust trading signals?
- What are some advanced trading strategies that utilize ATR for various market conditions like trending or ranging markets?
- How does the Average True Range compare and contrast with other popular volatility indicators such as Bollinger Bands or Keltner Channels?
- Beyond stop-losses, can the Average True Range also be effectively used for setting profit targets in stock trading strategies?
References
Last updated May 16, 2025