
Unlock Automated AWS Cost Savings Reports with Python: Your Monthly Update Solution!
Discover how to leverage Python scripts to automatically fetch, analyze, and visualize your AWS Savings Plan data for insightful customer reports.
Automating your AWS monthly cost savings reports can significantly streamline your workflow and provide your customers with timely, accurate insights. By using Python scripts, you can connect to AWS services, retrieve the latest data from your Cost Savings Plans, and generate visualizations similar to those in the AWS console. This guide will walk you through the process, enabling you to create these reports efficiently for future months. My knowledge cutoff is Friday, 2025-05-09.
Key Highlights: Automating Your AWS Cost Reporting
- Automated Data Retrieval: Use Python and the AWS SDK (Boto3) to programmatically access real-time cost and Savings Plan data directly from AWS Cost Explorer, ensuring your reports always reflect the latest figures.
- Customizable Visualizations: Generate charts and graphs (e.g., bar charts showing savings, line graphs for trends) using Python libraries like Matplotlib or Seaborn, tailored to your customer's needs and mimicking AWS console visuals.
- Scheduled Reporting: Implement automation using AWS Lambda and Amazon EventBridge (or cron jobs) to run your Python scripts monthly, delivering updated reports without manual intervention.
Understanding the Core Components for Your Automated Reporting
To build an effective automated AWS cost savings report, it's crucial to understand the tools and data sources involved. This solution primarily revolves around Python's capabilities to interact with AWS services.
Data Source: AWS Cost Explorer
The cornerstone of your report will be the data retrieved from the AWS Cost Explorer API. This service provides detailed information about your AWS costs and usage. Specifically for Savings Plans, you can access metrics like:
- Savings Plan utilization
- Savings Plan coverage
- Realized savings compared to On-Demand prices
- Effective costs after Savings Plan discounts
By querying this API, your Python script can obtain the raw data needed to calculate savings and populate your report and charts.
Python and Key Libraries
Python is an excellent choice for this task due to its extensive libraries for interacting with APIs, processing data, and creating visualizations.
- Boto3: The official AWS SDK for Python. It allows your script to authenticate with your AWS account and make calls to services like Cost Explorer.
- Pandas: A powerful data manipulation library. You'll use Pandas to structure the retrieved cost data into DataFrames, making it easier to analyze, filter, and aggregate.
- Matplotlib & Seaborn: Popular plotting libraries. These enable you to create a wide variety of static, animated, and interactive visualizations, such as bar charts, line graphs, or pie charts, to represent the cost savings.
- Openpyxl (Optional): If you need to generate reports in Excel format (
.xlsx), Openpyxl can be used to write data and even embed charts directly into Excel files.
Setting Up Your Environment
Before you start scripting, ensure your development environment is correctly configured.
Prerequisites
- An AWS account with programmatic access (API keys).
- Appropriate IAM permissions for the user or role that will run the script. This typically includes permissions for AWS Cost Explorer (e.g.,
ce:GetCostAndUsage,ce:GetSavingsPlansCoverage). - Python installed on your system (Python 3.7 or newer recommended).
Installing Necessary Libraries
You can install the required Python libraries using pip:
pip install boto3 pandas matplotlib seaborn openpyxlEnsure your AWS credentials are configured for Boto3, typically via the AWS CLI (aws configure) or by setting environment variables.
Crafting the Python Script: A Step-by-Step Approach
The Python script will generally follow these steps: connect to AWS, fetch data, process it, generate visualizations, and then create a report.
Step 1: Importing Libraries and Configuration
Start your script by importing the necessary libraries and defining any configurations, such as the AWS region or report date ranges.
import boto3
import pandas as pd
import matplotlib.pyplot as plt
import seaborn as sns
from datetime import datetime, timedelta

# Configuration
AWS_REGION = "us-east-1" # Or your preferred region
# For last month's report
today = datetime.today()
first_day_of_current_month = today.replace(day=1)
last_day_of_last_month = first_day_of_current_month - timedelta(days=1)
first_day_of_last_month = last_day_of_last_month.replace(day=1)

START_DATE = first_day_of_last_month.strftime('%Y-%m-%d')
END_DATE = last_day_of_last_month.strftime('%Y-%m-%d')
Step 2: Fetching Cost and Savings Plan Data
Accessing Cost Explorer with Boto3
Initialize the Boto3 client for Cost Explorer.
ce_client = boto3.client('ce', region_name=AWS_REGION)Querying Savings Plan Coverage
The get_savings_plans_coverage API call is key for understanding how well your Savings Plans are covering your eligible usage.
response_coverage = ce_client.get_savings_plans_coverage(
    TimePeriod={
        'Start': START_DATE,
        'End': END_DATE
    },
    Granularity='MONTHLY' # Or 'DAILY' for more detail
)
# Process response_coverage to extract coverage percentage, spend covered, etc.
# Example:
# for period_coverage in response_coverage.get('SavingsPlansCoverages', []):
#     coverage_percentage = period_coverage.get('Coverage', {}).get('CoveragePercentage', '0')
#     spend_covered = period_coverage.get('SpendCovered', '0')
Retrieving Cost and Usage Data
Use get_cost_and_usage to fetch detailed cost data. You can group by service, usage type, or other dimensions, and filter as needed.
response_cost = ce_client.get_cost_and_usage(
    TimePeriod={
        'Start': START_DATE,
        'End': END_DATE
    },
    Granularity='MONTHLY',
    Metrics=['UnblendedCost', 'UsageQuantity'], # Add other metrics as needed
    GroupBy=[
        {'Type': 'DIMENSION', 'Key': 'SERVICE'},
    ],
    Filter={ # Example: Exclude credits and refunds
        'Not': {
            'Dimensions': {
                'Key': 'RECORD_TYPE',
                'Values': ['Credit', 'Refund', 'Tax']
            }
        }
    }
)
# Process response_cost to extract cost data per service or overall
# This data can be used to show total costs, and when combined with Savings Plan details,
# you can calculate On-Demand equivalent costs to demonstrate savings.
Step 3: Processing and Analyzing Data with Pandas
Once you have the raw JSON data from AWS, Pandas makes it easy to convert it into a structured format for analysis.
# Example: Converting 'ResultsByTime' from get_cost_and_usage to a DataFrame
cost_data_list = []
if 'ResultsByTime' in response_cost:
    for result_by_time in response_cost['ResultsByTime']:
        time_period_start = result_by_time['TimePeriod']['Start']
        for group in result_by_time['Groups']:
            service_name = group['Keys'][0]
            amount = float(group['Metrics']['UnblendedCost']['Amount'])
            cost_data_list.append({'Date': time_period_start, 'Service': service_name, 'Cost': amount})

df_costs = pd.DataFrame(cost_data_list)
# Further processing: aggregate costs, merge with savings data, calculate savings percentages.
Calculating Savings
Calculating actual savings often involves comparing the effective cost under Savings Plans to what the cost would have been at On-Demand rates. The Cost Explorer data for SavingsPlansCoverages provides SavingsPlansSavings, which represents the savings AWS calculates for you. You can also calculate this manually if you fetch On-Demand equivalent costs for the usage covered by Savings Plans.
Step 4: Generating Visualizations
Use Matplotlib or Seaborn to create charts. For instance, a bar chart showing "On-Demand Cost vs. Actual Cost with Savings Plan" or "Total Savings per Month" can be very effective.
Creating Charts with Matplotlib/Seaborn
# Example: Simple bar chart for costs by service
plt.figure(figsize=(12, 7))
sns.barplot(data=df_costs, x='Service', y='Cost', estimator=sum, ci=None)
plt.title(f'AWS Costs by Service for {START_DATE} to {END_DATE}')
plt.xlabel('Service')
plt.ylabel('Cost (USD)')
plt.xticks(rotation=45, ha='right')
plt.tight_layout()
plt.savefig('aws_costs_by_service.png') # Save the chart as an image
# plt.show() # To display the chart if running locally
To create a chart similar to what you might see in the AWS Savings Plan console, you might plot total On-Demand equivalent cost, total Savings Plan cost, and the resulting savings. This often requires careful data extraction and structuring from the GetSavingsPlansUtilization and GetSavingsPlansCoverage API responses.
Embedding Charts in Excel (Optional)
If you're generating an Excel report using openpyxl, you can save your Matplotlib charts as images and then insert them into an Excel sheet. Alternatively, libraries like XlsxWriter (used with Pandas ExcelWriter) offer more direct chart embedding capabilities within Excel.
Visualizing Key Aspects of Your AWS Cost Reporting Solution
To better understand the components and effectiveness of an automated AWS cost reporting solution built with Python, the following radar chart highlights key evaluation criteria. A well-rounded solution will score highly across these dimensions, indicating a robust, efficient, and insightful reporting mechanism.
This chart compares a Python-based automated solution against a manual approach, illustrating the significant advantages of automation in areas like data accuracy, scalability, and the level of automation itself.
Understanding the Reporting Workflow
The following mindmap illustrates the typical workflow for generating automated AWS cost savings reports using Python. It outlines the journey from data acquisition to the final distribution of the report.
Generation with Python"] id1["Data Acquisition"] id1a["AWS Cost Explorer API"] id1b["Boto3 SDK"] id1c["GetSavingsPlansCoverage API"] id1d["GetCostAndUsage API"] id2["Data Processing & Analysis"] id2a["Python Scripts"] id2b["Pandas DataFrames"] id2c["Filtering & Cleaning Data"] id2d["Calculating Savings & Coverage"] id2e["Aggregating Data (Monthly, by Service)"] id3["Visualization"] id3a["Matplotlib / Seaborn"] id3b["Bar Charts (Costs, Savings)"] id3c["Line Graphs (Trends)"] id3d["Pie Charts (Cost Distribution)"] id4["Report Generation"] id4a["Output to Files (PNG, JPG)"] id4b["Excel Reports (Openpyxl/XlsxWriter)"] id4ba["Data Tables"] id4bb["Embedded Charts"] id4c["PDF Reports (Optional, using other libraries)"] id5["Automation & Scheduling"] id5a["AWS Lambda"] id5b["Amazon EventBridge (Scheduler)"] id5c["Cron Jobs (Local/EC2)"] id5d["Monthly Execution Cycle"] id6["Report Distribution (Optional)"] id6a["Store in Amazon S3 Bucket"] id6b["Email via Amazon SES"] id6c["Notifications (e.g., Slack)"]
This mindmap provides a clear overview of each stage, helping you to structure your Python script and automation pipeline effectively.
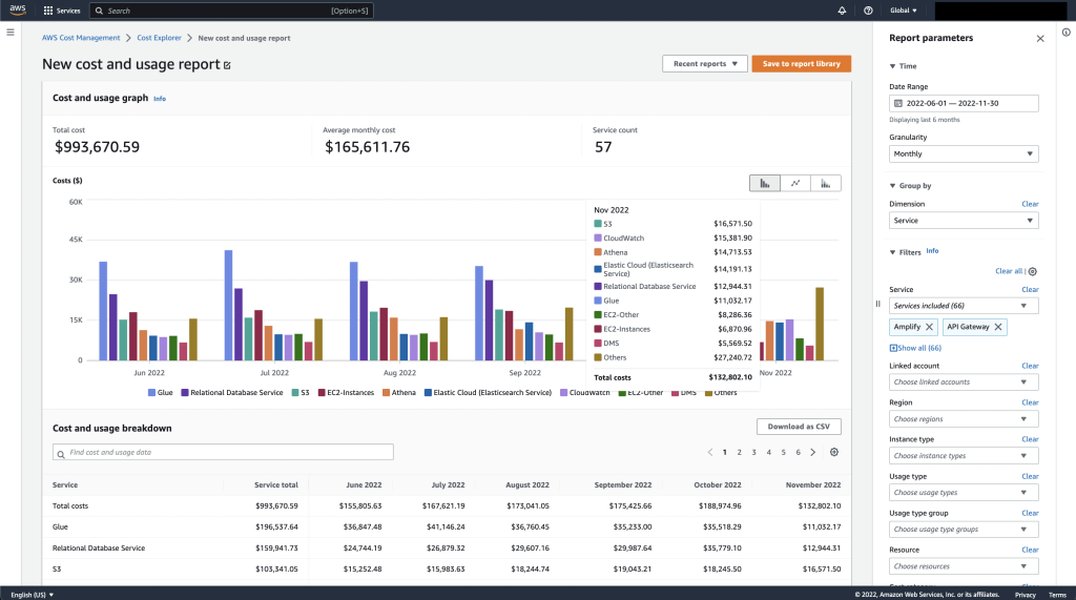
Example of AWS Cost Explorer interface, which your Python script can programmatically access data from.
Automating Your Monthly Reporting
The true power of using Python scripts comes from automation. You can set up your script to run automatically each month.
Scheduling with AWS Lambda and Amazon EventBridge
This is a serverless approach and often the most cost-effective and scalable:
- Package your Python script: Include all dependencies (libraries not available in the Lambda runtime by default need to be packaged in a deployment package or Lambda layer).
- Create an AWS Lambda function: Upload your script. Configure environment variables (e.g., for S3 bucket names if you store reports there) and set appropriate IAM roles with permissions for Cost Explorer and any other services your script uses (like S3 or SES).
- Create an Amazon EventBridge (CloudWatch Events) rule: Set up a schedule (e.g., "run on the 2nd day of every month") to trigger your Lambda function.
Alternative: Local Scheduling with Cron Jobs
If you prefer, or if your script has dependencies that are difficult to manage in Lambda, you can run it on an EC2 instance or a local server using cron (Linux/macOS) or Task Scheduler (Windows).
- Ensure the machine running the script has the AWS CLI configured and the necessary Python environment.
- Set up a cron job to execute your Python script on your desired schedule. Example cron expression for running at 2 AM on the first day of every month:
0 2 1 * * /usr/bin/python3 /path/to/your/script.py
Distributing the Report
Once your script generates the report (e.g., an image file of the chart or an Excel file):
- Store in Amazon S3: You can programmatically upload the report to an S3 bucket. This allows for easy access control and sharing.
- Email via Amazon SES: Your script can use Amazon Simple Email Service (SES) to automatically email the report to your customer.
- Notifications: Integrate with services like Slack for notifications when a new report is ready.
Exploring AWS Cost Automation with Python
The following video provides insights into automating AWS cost and usage reporting, which aligns with the goals of generating monthly savings plan reports. While it may cover broader Cost and Usage Reports (CUR), the principles of using Lambda, EventBridge, and Cost Explorer APIs are highly relevant to your specific need for Savings Plan reporting.
This video demonstrates how to automate AWS Cost & Usage reports using EventBridge, Lambda, and the AWS Cost Explorer API, providing valuable context for your automation efforts.
Watching this can give you a practical overview of setting up the AWS services involved in the automation pipeline, complementing the Python script development.
Key Tools and Services at a Glance
This table summarizes the primary AWS services and Python libraries involved in creating your automated AWS cost savings report:
| Tool/Service | Purpose in Your Solution | Key Features/Benefits |
|---|---|---|
| AWS Cost Explorer API | Primary data source for cost, usage, and Savings Plan metrics. | Provides programmatic access to granular cost data, Savings Plan utilization, and coverage. |
| Boto3 | AWS SDK for Python. | Enables Python scripts to interact with AWS services, including Cost Explorer. |
| Pandas | Data manipulation and analysis library. | Efficiently handles and structures data (DataFrames) for calculations and preparation for visualization. |
| Matplotlib / Seaborn | Data visualization libraries. | Create a wide variety of charts (bar, line, pie) to visually represent savings and cost trends. |
| Openpyxl / XlsxWriter | Python libraries to read/write Excel files. | Useful for generating formatted Excel reports, potentially embedding charts. |
| AWS Lambda | Serverless compute service. | Runs your Python script without needing to manage servers; ideal for scheduled tasks. |
| Amazon EventBridge | Serverless event bus and scheduler. | Triggers your Lambda function (or other targets) on a defined schedule (e.g., monthly). |
| Amazon S3 | Object storage service. | Securely store generated reports (images, Excel files, PDFs). |
| Amazon SES (Optional) | Email sending service. | Automate the distribution of reports to customers via email. |
By combining these tools effectively, you can build a robust and automated reporting system tailored to your customer's needs.
Frequently Asked Questions (FAQ)
Recommended Further Exploration
To deepen your understanding and enhance your reporting capabilities, consider exploring these related topics:
- How to use Python with Boto3 to get detailed AWS Savings Plan utilization reports?
- Techniques for advanced AWS cost anomaly detection using Python and machine learning?
- Best practices for securing AWS credentials when running Python scripts for cost management?
- How to integrate AWS cost reports generated by Python with business intelligence tools like Amazon QuickSight?
References
 boto3.amazonaws.com
 docs.aws.amazon.com
 aws.amazon.com
docs.aws.amazon.com
aws.amazon.com
docs.aws.amazon.com
docs.aws.amazon.com
docs.aws.amazon.com
docs.aws.amazon.com
aws.amazon.com
docs.aws.amazon.com
docs.aws.amazon.com
aws.amazon.com
aws.amazon.com
docs.aws.amazon.com
aws.amazon.com
docs.aws.amazon.com
docs.aws.amazon.com
docs.aws.amazon.com
docs.aws.amazon.com
aws.amazon.com
docs.aws.amazon.com
docs.aws.amazon.com
Last updated May 9, 2025