
Unpacking the Nuances: What Does Data Reveal About Average IQ Among White Americans?
Exploring the reported average IQ scores for White individuals in the US, contextual factors, and the complexities of intelligence measurement.
Key Insights
- Reported Average Range: Studies generally place the average IQ score for White Americans between 100 and 103, with 100 aligning with standard test norms and 103 emerging from specific analyses of non-Hispanic Whites.
- Influencing Factors: IQ scores are not solely determined by innate ability but are significantly influenced by a complex interplay of factors including education, socioeconomic status, environment, nutrition, and test methodology.
- Context is Crucial: Average scores represent statistical snapshots of large groups and do not define individual potential. There is substantial IQ score variation within any racial or ethnic group, and understanding the limitations and potential biases of IQ testing is essential.
What is the Reported Average IQ for White Americans?
The 100-103 Range Explained
Based on analyses of standardized test data and large-scale studies, the average Intelligence Quotient (IQ) for White people in the United States is consistently reported to fall within a narrow range, typically between 100 and 103.
The Benchmark Score: 100
Many sources cite the average IQ for White Americans as approximately 100. This figure aligns with the historical norming process of many standard IQ tests, where the average score for the reference population (often historically based predominantly on White samples) was set to 100, with a standard deviation of 15. This benchmark is frequently used in comparative studies examining score differences across various demographic groups.
The Higher Estimate: 103
Some specific analyses, particularly those focusing on non-Hispanic White individuals, report a slightly higher average IQ of around 103. This figure emerges from certain large datasets and studies that may use different methodologies or sample populations, potentially including adjustments for various factors. While slightly different, both 100 and 103 fall close together and are often presented as the typical average range.
It is vital to remember that these figures are statistical averages derived from group data and do not reflect the intelligence of any single individual. Intelligence is multifaceted, and IQ tests measure only certain cognitive abilities.
Contextualizing the Numbers: Comparisons and Trends
Comparative Averages Across Groups
IQ research often involves comparing average scores across different racial and ethnic groups. While these comparisons are complex and subject to debate regarding influencing factors (environmental, social, cultural, and testing biases), consistent patterns emerge in US-based studies. The table below summarizes approximate average IQ ranges reported for major racial/ethnic groups in the US, based on the provided data.
| Group | Reported Average IQ Range (Approximate) |
|---|---|
| Asian Americans | 103 - 108 |
| White Americans | 100 - 103 |
| Hispanic Americans | 91 - 94 (often reported in the mid-90s) |
| African Americans | 85 - 91 |
Important Note: These are group averages with significant overlap in score distributions between groups. Many factors contribute to these differences, and they should not be used to stereotype individuals. The causes of these average differences are a subject of ongoing scientific discussion, with considerable emphasis placed on environmental and socioeconomic factors.
Broader US IQ Trends
The overall average IQ for the entire US population is sometimes reported slightly below 100 (e.g., around 96-98 in some recent estimates). This national average is influenced by the country's diverse demographic composition and the varying average scores across different groups.
Historically, many industrialized nations observed a phenomenon known as the "Flynn Effect," where average IQ scores steadily increased throughout the 20th century. This rise is generally attributed to improvements in nutrition, healthcare, education, and increased exposure to complex problem-solving environments. However, the continuation and rate of the Flynn Effect in the 21st century are subjects of ongoing research, with some suggestions of stagnation or even reversal in certain populations.
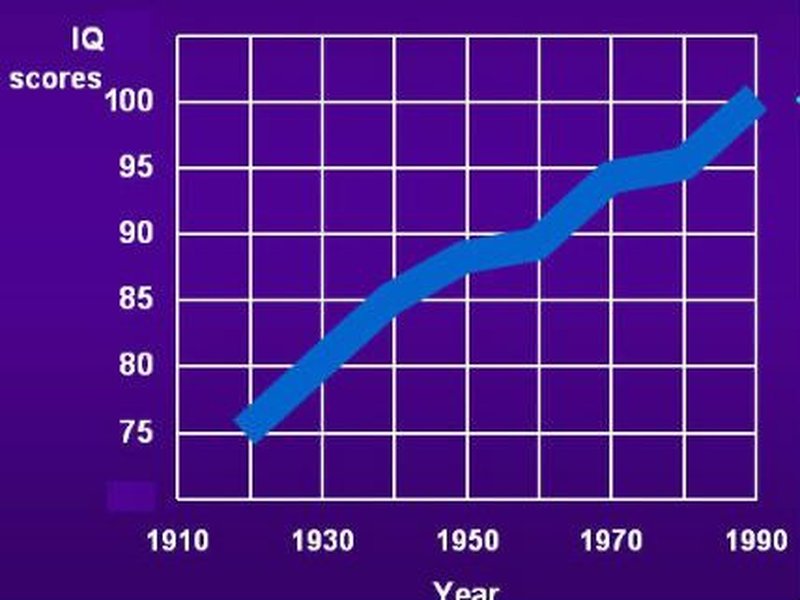
Illustration related to the Flynn Effect, showing historical increases in average IQ scores.
Influencing Factors: Beyond the Score
Average IQ scores are influenced by a wide array of factors that go far beyond innate cognitive ability. Understanding these influences is critical to interpreting IQ data responsibly.
Environmental and Socioeconomic Impacts
Access to Quality Education
The availability and quality of schooling, from early childhood programs to higher education, play a significant role. Educational systems that emphasize critical thinking, abstract reasoning, and problem-solving can positively impact performance on IQ tests, which often assess these skills.
Socioeconomic Status (SES)
SES encompasses factors like income, parental education, and occupation. Higher SES is often correlated with access to better resources, including enriched learning environments, better nutrition, superior healthcare, and reduced exposure to environmental toxins, all of which can contribute to cognitive development.
Nutrition and Healthcare
Adequate nutrition, particularly during critical developmental periods in early childhood, is essential for brain development. Access to quality healthcare, including prenatal care and treatment for childhood illnesses, also supports healthy cognitive function.
Cultural and Testing Considerations
Test Design and Cultural Alignment
IQ tests are designed within specific cultural contexts. Critics argue that some tests may contain cultural biases, favoring individuals familiar with the language, norms, and types of reasoning prevalent in the culture where the test was developed. Performance can be affected if the test content or format is less familiar to individuals from different cultural backgrounds.
Testing Environment
Factors related to the testing situation itself, such as stereotype threat (the fear of confirming negative stereotypes about one's group, which can impair performance) or rapport with the test administrator, can also influence scores.
Visualizing Influential Factors
The following chart provides a hypothetical visualization of how various environmental and social factors might differentially impact average cognitive development opportunities across different demographic groups in the US. It's important to emphasize that this chart is illustrative, based on general societal observations discussed in research, and does not represent precise empirical data. It aims to highlight the complex interplay of factors thought to influence cognitive outcomes, rather than presenting definitive scores.
Understanding Intelligence: More Than IQ
The Limits of IQ Tests
IQ tests are designed to measure specific cognitive abilities, such as logical reasoning, abstract thinking, problem-solving, verbal comprehension, and processing speed. While these skills are important aspects of intelligence and correlate with academic and professional success to some degree, IQ scores do not capture the full spectrum of human intelligence. They typically do not measure:
- Creativity and innovation
- Emotional intelligence (understanding and managing one's own and others' emotions)
- Practical intelligence or "street smarts"
- Social skills and interpersonal abilities
- Artistic, musical, or kinesthetic talents
- Wisdom and ethical judgment
Relying solely on IQ scores provides an incomplete picture of an individual's capabilities and potential.
Individual Variation vs. Group Averages
It cannot be stressed enough that group averages, like those discussed for different racial groups, do not predict an individual's intelligence. Within any population group, there is a vast range of IQ scores. The variation *within* a single group is significantly larger than the average difference *between* groups. This means there is substantial overlap in the distribution of IQ scores across all groups. Attributing characteristics or capabilities to an individual based solely on their group affiliation is a form of stereotyping and is scientifically unfounded.
Mindmap: Key Concepts in US White Average IQ
This mindmap summarizes the core ideas discussed regarding the average IQ of White people in the United States, including the reported scores, influencing factors, comparisons, and limitations.
/Non-Hispanic Whites)"] id2["Influencing Factors"] id2a["Environment"] id2b["Socioeconomic Status (SES)"] id2c["Education Quality & Access"] id2d["Nutrition & Healthcare"] id2e["Test Design & Cultural Bias"] id3["Group Comparisons (US Averages)"] id3a["Asian Americans (Higher Avg.)"] id3b["Hispanic Americans (Lower Avg.)"] id3c["African Americans (Lower Avg.)"] id3d["Note: Significant Overlap
Between Groups"] id4["Limitations of IQ"] id4a["Measures Specific Cognitive Skills"] id4b["Doesn't Capture Full Intelligence
(e.g., Creativity, EQ, Practical Skills)"] id5["Key Considerations"] id5a["Individual Variation is Large"] id5b["Averages Don't Define Individuals"] id5c["Sensitivity & Complexity of Topic"] id5d["Avoid Stereotyping"]
Exploring Perspectives on Disparities
The topic of group differences in cognitive test scores is complex and often discussed in relation to broader societal disparities. Understanding the factors contributing to these differences involves examining historical context, economic factors, educational opportunities, and potential biases. The video below features economist Thomas Sowell discussing related themes, offering one perspective on disparities and their potential causes, often emphasizing factors beyond innate ability.
Discussions around IQ and group differences require careful consideration of evidence, awareness of potential biases in both testing and interpretation, and a focus on the multitude of factors that shape individual and group outcomes.
Frequently Asked Questions (FAQ)
Is 103 a more accurate average IQ for White Americans than 100?
Both 100 and 103 appear in different studies and analyses. 100 often represents the standard benchmark based on how IQ tests were historically normed. 103 sometimes appears in more specific analyses, such as those focusing exclusively on non-Hispanic White populations or using particular datasets. Neither is definitively "more accurate" without knowing the specifics of the study methodology and sample. Both fall within a close range, suggesting the average is centered around this area.
Do average IQ differences between groups mean one group is inherently 'smarter'?
No. Average group differences in IQ scores do not equate to inherent intellectual superiority or inferiority. IQ tests measure specific cognitive skills influenced by numerous environmental, social, economic, and educational factors. Furthermore, 'intelligence' is a broad concept not fully captured by IQ tests. There is significant overlap in scores between groups, and individual potential varies widely within every group. Attributing intelligence levels based on group membership is inaccurate and promotes harmful stereotypes.
Are IQ tests biased?
The question of bias in IQ testing is complex. Some argue that tests can be culturally biased, favoring those familiar with the language, content, and reasoning styles prevalent in the culture where the test was developed. Others argue that modern tests have undergone revisions to reduce overt bias and that they predict academic and occupational outcomes similarly across groups (though this predictive validity itself can be debated). Factors like socioeconomic background, educational quality, and stereotype threat can also impact performance, creating score differences that may not reflect underlying cognitive ability differences alone.
Has the average IQ of White Americans changed over time?
Like other groups in industrialized nations, White Americans likely experienced score increases during the 20th century due to the Flynn Effect (improvements in nutrition, education, etc.). However, the average relative to the test norm (often set at 100) has remained relatively stable around the 100-103 mark in comparative studies over recent decades. Tracking precise changes requires consistent, longitudinal data and careful consideration of test revisions and demographic shifts.
Recommended
- What factors influence IQ scores besides genetics?
- How has the Flynn Effect changed IQ scores globally?
- What are the limitations of using IQ tests to measure intelligence?
- What is the relationship between socioeconomic status and cognitive development?
References
Last updated April 27, 2025