
Unlock Automated AWS Cost Insights: Python-Powered Reporting and Savings Plan Updates
Streamline your monthly AWS financial reporting with Python, dynamically visualizing cost savings and keeping your plans current.
Managing AWS costs effectively and providing clear, up-to-date reports to customers is crucial. This guide will walk you through leveraging Python to automate the generation of AWS monthly cost reports, including visualizing savings from your Cost Savings Plans, and how to reflect updates related to these plans. By using the AWS Cost Explorer API and Python's powerful data handling and visualization libraries, you can create a repeatable process for insightful monthly reporting.
Key Highlights
- Automated Data Retrieval: Utilize the AWS Cost Explorer API via Python (Boto3) to fetch real-time cost, usage, and Savings Plans data.
- Dynamic Chart Generation: Create informative charts (e.g., pie or bar charts) using libraries like Matplotlib to visualize cost breakdowns and savings, similar to the AWS console.
- Repeatable Monthly Reporting: Develop a Python script that can be easily run each month with updated date parameters, ensuring consistent and timely reports.
Preparing Your Environment
Before diving into the script, ensure your environment is set up correctly. This involves configuring AWS access and installing the necessary Python libraries.
AWS Account and IAM Permissions
Your Python script will need programmatic access to your AWS account. It's best practice to use an IAM role with the principle of least privilege. The necessary permissions typically include:
ce:GetCostAndUsagece:GetSavingsPlansCoveragece:GetSavingsPlansUtilizationbudgets:DescribeBudgets(if reading budget information)budgets:UpdateBudget(if you intend to programmatically update AWS Budgets related to your savings plans)
Ensure your AWS credentials (access key, secret key, and optionally session token) are configured in your environment where the script will run. This can be done via the AWS CLI (aws configure), environment variables, or IAM roles for EC2/Lambda.
Python Libraries Installation
You'll need a few key Python libraries. Install them using pip:
pip install boto3 pandas matplotlib openpyxl- Boto3: The AWS SDK for Python, allowing interaction with AWS services.
- Pandas: For efficient data manipulation and analysis.
- Matplotlib: For creating static, animated, and interactive visualizations.
- Openpyxl: (Optional) If you plan to export data or charts to Excel files.
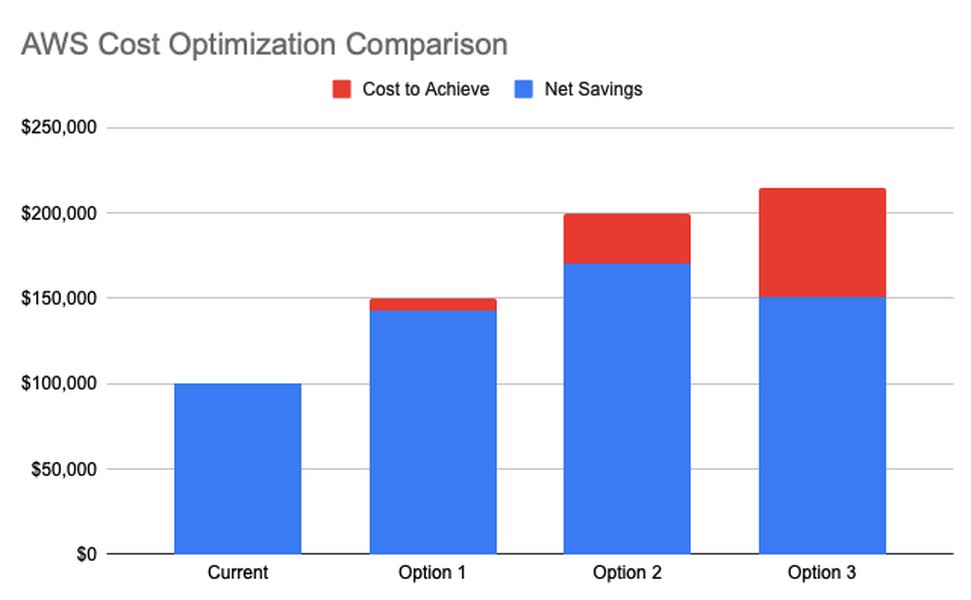
Conceptualizing AWS Cost Optimization Strategies.
Crafting Your Python Script for AWS Cost Reporting
The Python script will perform several key actions: connect to AWS, fetch cost and Savings Plan data, process this data, and generate a visual report.
Step 1: Initialization and Configuration
Start by importing the necessary libraries and initializing the Boto3 client for AWS Cost Explorer.
import boto3
import pandas as pd
import matplotlib.pyplot as plt
from datetime import datetime, timedelta, date

# Initialize Cost Explorer client
# Ensure your AWS region is correctly specified if not using the default.
ce_client = boto3.client('ce') # Example: boto3.client('ce', region_name='us-east-1')
budgets_client = boto3.client('budgets') # For updating AWS Budgets
Step 2: Defining the Reporting Period
Dynamically determine the start and end dates for your report. For a monthly report, this would typically be the previous full month.
def get_previous_month_period():
    today = date.today()
    first_day_of_current_month = today.replace(day=1)
    last_day_of_previous_month = first_day_of_current_month - timedelta(days=1)
    first_day_of_previous_month = last_day_of_previous_month.replace(day=1)
    return first_day_of_previous_month.strftime('%Y-%m-%d'), last_day_of_previous_month.strftime('%Y-%m-%d')

start_date, end_date = get_previous_month_period()
print(f"Reporting period: {start_date} to {end_date}")
Step 3: Fetching Cost and Savings Plan Data
Use the Cost Explorer API to retrieve the data. The GetCostAndUsage API is fundamental here. You can also fetch specific Savings Plans metrics.
Fetching General Cost and Usage
def get_cost_and_usage_data(start, end):
    try:
        response = ce_client.get_cost_and_usage(
            TimePeriod={'Start': start, 'End': end},
            Granularity='MONTHLY',
            Metrics=['UnblendedCost', 'AmortizedCost'], # AmortizedCost reflects SP discounts
            GroupBy=[
                {'Type': 'DIMENSION', 'Key': 'SERVICE'},
                # You can add other dimensions like 'LINKED_ACCOUNT'
            ]
        )
        return response['ResultsByTime']
    except Exception as e:
        print(f"Error fetching cost and usage data: {e}")
        return None

cost_data_raw = get_cost_and_usage_data(start_date, end_date)
Fetching Savings Plans Coverage and Utilization
To understand how well your Savings Plans are performing, you can fetch coverage and utilization data.
def get_savings_plans_coverage_data(start, end):
    try:
        response = ce_client.get_savings_plans_coverage(
            TimePeriod={'Start': start, 'End': end},
            Granularity='MONTHLY'
            # You can add GroupBy here as well if needed
        )
        return response['SavingsPlansCoverages']
    except Exception as e:
        print(f"Error fetching Savings Plans coverage: {e}")
        return None

def get_savings_plans_utilization_data(start, end):
    try:
        response = ce_client.get_savings_plans_utilization(
            TimePeriod={'Start': start, 'End': end},
            Granularity='MONTHLY'
        )
        return response['SavingsPlansUtilizations'] # Note the key might be 'Total' or specific plans
    except Exception as e:
        print(f"Error fetching Savings Plans utilization: {e}")
        return None

coverage_data = get_savings_plans_coverage_data(start_date, end_date)
utilization_data = get_savings_plans_utilization_data(start_date, end_date)

# Example of extracting total utilization (simplified)
if utilization_data and len(utilization_data) > 0:
    total_utilization = utilization_data[0].get('Total', {}).get('UtilizationPercentage', 'N/A')
    print(f"Total Savings Plan Utilization: {total_utilization}%")
Step 4: Processing Data with Pandas
Transform the raw API response into a structured format using Pandas for easier analysis and calculation of savings.
def process_cost_data(cost_data_raw):
    if not cost_data_raw:
        return pd.DataFrame()

    rows = []
    for result_by_time in cost_data_raw:
        for group in result_by_time['Groups']:
            service_name = group['Keys'][0]
            amortized_cost = float(group['Metrics']['AmortizedCost']['Amount'])
            unblended_cost = float(group['Metrics']['UnblendedCost']['Amount'])
            # Savings can be estimated as Unblended - Amortized for services covered by SP
            # More precise savings might need comparing costs with and without SP benefits if available directly
            estimated_savings = unblended_cost - amortized_cost
            rows.append({
                'Service': service_name,
                'AmortizedCost': amortized_cost,
                'UnblendedCost': unblended_cost,
                'EstimatedSavings': estimated_savings if estimated_savings > 0 else 0
            })
    df = pd.DataFrame(rows)
    return df

cost_df = process_cost_data(cost_data_raw)
if not cost_df.empty:
    print(cost_df.head())
    total_amortized_cost = cost_df['AmortizedCost'].sum()
    total_estimated_savings = cost_df['EstimatedSavings'].sum()
    print(f"Total Amortized Cost: ${total_amortized_cost:.2f}")
    print(f"Total Estimated Savings from Plans: ${total_estimated_savings:.2f}")
else:
    print("No cost data processed.")
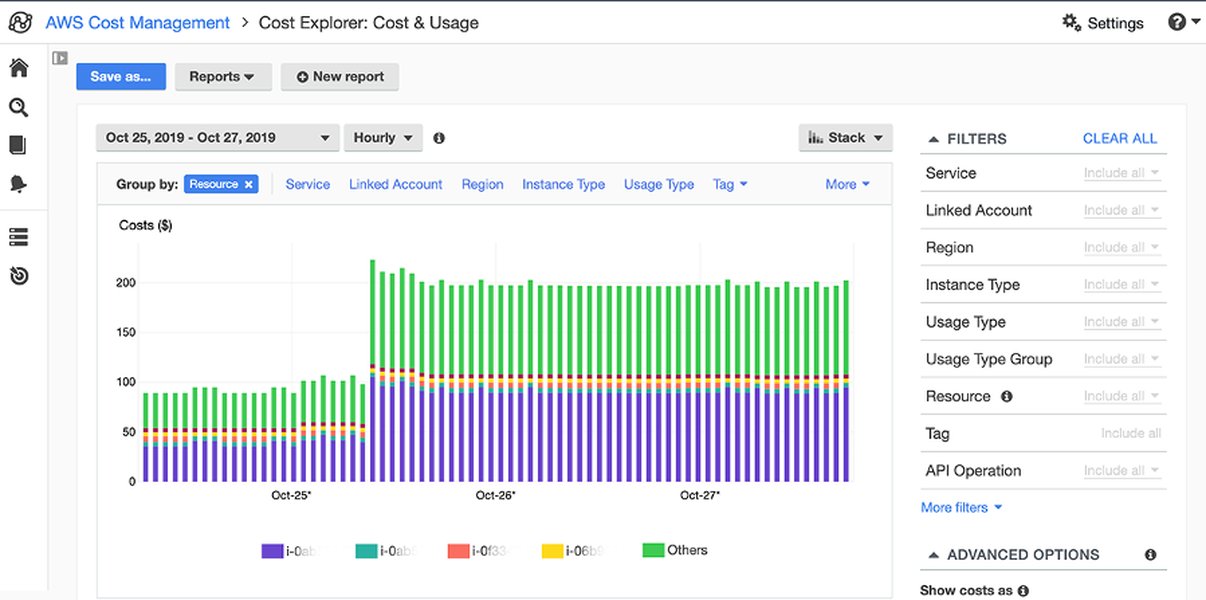
Example of AWS Cost Explorer interface, which provides the data source for the script.
Step 5: Generating the Chart with Matplotlib
Create a visual representation of the cost data. A pie chart can show the cost after savings vs. the savings amount, or a bar chart can show costs per service.
def generate_savings_pie_chart(total_cost_after_savings, total_savings, filename='aws_cost_savings_pie.png'):
    if total_cost_after_savings <= 0 and total_savings <= 0:
        print("No data to plot for pie chart.")
        return

    labels = ['Cost After Savings', 'Savings Plan Savings']
    sizes = [total_cost_after_savings, total_savings]
    # Ensure only positive values are plotted if one is zero or negative
    valid_indices = [i for i, size in enumerate(sizes) if size > 0]
    labels = [labels[i] for i in valid_indices]
    sizes = [sizes[i] for i in valid_indices]

    if not sizes:
        print("No positive values to plot for pie chart.")
        return

    colors = ['#66b3ff','#ff9999'] # Blueish for cost, reddish for savings
    explode = tuple([0.1 if label == 'Savings Plan Savings' else 0 for label in labels])


    plt.figure(figsize=(8, 8))
    plt.pie(sizes, explode=explode, labels=labels, colors=colors, autopct='%1.1f%%',
            shadow=True, startangle=140)
    plt.axis('equal')  # Equal aspect ratio ensures that pie is drawn as a circle.
    plt.title(f'AWS Cost Breakdown (Period: {start_date} to {end_date})')
    plt.savefig(filename)
    plt.show()
    print(f"Chart saved as {filename}")

# Assuming total_amortized_cost is cost after savings for this context
if 'total_amortized_cost' in locals() and 'total_estimated_savings' in locals():
    if total_amortized_cost > 0 or total_estimated_savings > 0:
         generate_savings_pie_chart(total_amortized_cost - total_estimated_savings, total_estimated_savings)
    else:
        print("Skipping chart generation due to zero or negative costs/savings.")
else:
    print("Cost variables not defined, skipping chart generation.")
Step 6: Reflecting Updates to Savings Plans (via AWS Budgets)
While the script primarily focuses on *reporting* the impact of existing Savings Plans, "updating" a plan often means adjusting budgetary expectations or targets. You can use the AWS Budgets API to update a budget associated with your cost management strategy.
def update_aws_budget(account_id, budget_name, new_budget_limit_usd):
    try:
        budgets_client.update_budget(
            AccountId=account_id,
            Budget={
                'BudgetName': budget_name,
                'BudgetLimit': {
                    'Amount': str(new_budget_limit_usd),
                    'Unit': 'USD'
                },
                'TimeUnit': 'MONTHLY',
                'BudgetType': 'COST',
                # Include other parameters like CostTypes, TimePeriod, Notifications as per your existing budget structure
                # For example, to ensure you're updating the correct budget:
                # 'CostFilters': {
                # 'Service': ['Amazon Elastic Compute Cloud - Compute'] # Example filter
                # }
            }
        )
        print(f"Budget '{budget_name}' updated successfully with new limit: ${new_budget_limit_usd}.")
    except Exception as e:
        print(f"Error updating budget '{budget_name}': {e}")

# Example usage (replace with your actual Account ID, Budget Name, and new limit)
# aws_account_id = "123456789012"
# target_budget_name = "MyMonthlyComputeSavingsPlanBudget"
# new_monthly_target = 750.00 # Example new target
# update_aws_budget(aws_account_id, target_budget_name, new_monthly_target)
Important: Programmatically updating budgets should be done cautiously. Ensure you are targeting the correct budget and that the new limit aligns with your financial strategy. This step is optional and depends on whether "updating the plan" implies adjusting financial targets in AWS Budgets.
Visualizing Savings Plan Effectiveness
Beyond simple cost breakdowns, a radar chart can offer a multi-dimensional view of your Savings Plan strategy's effectiveness. The chart below visualizes hypothetical scores for key aspects of a Savings Plan, such as coverage, utilization, actual cost reduction, flexibility, and alignment with commitments. Higher scores (further from the center) indicate better performance in that area.
This radar chart helps in quickly assessing if your Savings Plans are meeting their objectives across various important metrics, allowing for more strategic adjustments.
Mapping the AWS Cost Reporting Ecosystem
To better understand the components involved in this automated AWS cost reporting process, the following mindmap illustrates the key elements and their relationships. It shows how AWS services, Python libraries, and core concepts interlink to achieve your reporting goals.
This mindmap provides a high-level overview, helping to visualize how each part contributes to the overall solution for automated AWS cost reporting and Savings Plan analysis.
Automating for Future Monthly Reports
To make this process truly hands-off for future months, you can schedule your Python script to run automatically. Popular options include:
- AWS Lambda with CloudWatch Events: A serverless approach. You can package your Python script and its dependencies into a Lambda function and trigger it on a schedule (e.g., on the first day of every month) using CloudWatch Events (now Amazon EventBridge).
- Cron Job: If you have a server (like an EC2 instance) that's always running, you can set up a cron job to execute the script at regular intervals.
- Workflow Orchestration Tools: Services like AWS Step Functions or Apache Airflow can manage more complex workflows if your reporting needs grow.
When automating, ensure your script handles AWS credentials securely (e.g., using IAM roles for Lambda or EC2) and has robust error handling and logging.
This video demonstrates automating AWS Cost and Usage reports using EventBridge, Lambda, and Cost Explorer, aligning with the automation strategies discussed.
Illustrative Savings Plan Impact
The following table provides a simplified example of how you might present the impact of Savings Plans on costs for various AWS services in your report. Actual data would be dynamically generated by your Python script.
| AWS Service | Unblended Cost (Before SP) | Savings Plan Savings | Amortized Cost (After SP) | Effective Savings Rate |
|---|---|---|---|---|
| Amazon EC2 | $1500.00 | $300.00 | $1200.00 | 20.0% |
| AWS Lambda | $200.00 | $30.00 | $170.00 | 15.0% |
| Amazon S3 | $100.00 | $0.00 | $100.00 | 0.0% (If not covered by SP) |
| Amazon RDS | $450.00 | $90.00 | $360.00 | 20.0% |
| Total | $2250.00 | $420.00 | $1830.00 | 18.7% |
This table clearly distinguishes between costs before and after Savings Plan application, highlighting the value delivered by your commitment.
Key Considerations for Robust Reporting
- IAM Permissions Precision: Always grant only the necessary IAM permissions to your script, following the principle of least privilege.
- Cost Explorer API Nuances: Understand the difference between metrics like
UnblendedCostandAmortizedCost.AmortizedCostgenerally reflects the effective cost after Savings Plan discounts are spread out. Be aware of data availability latency (typically up to 24 hours). - Accuracy of Savings Calculation: The most straightforward way to show savings is by comparing
UnblendedCost(cost without some discounts) toAmortizedCost. For precise calculation of Savings Plan benefits, you might need to analyzeSavingsPlansCoveredUsageand the rates. AWS CUR (Cost and Usage Report) offers more granular data if needed. - Comprehensive Error Handling: Implement try-except blocks for API calls and data processing to gracefully handle potential issues like network failures, API throttling, or unexpected data formats.
- Customization: Tailor the script, data processing logic, and chart generation to meet your specific customer reporting requirements and visual preferences. The provided code is a template to be adapted.
- Data Granularity: Adjust the
GranularityandGroupByparameters inget_cost_and_usageto get the level of detail required for your report (e.g., daily vs. monthly, by tag, by account).
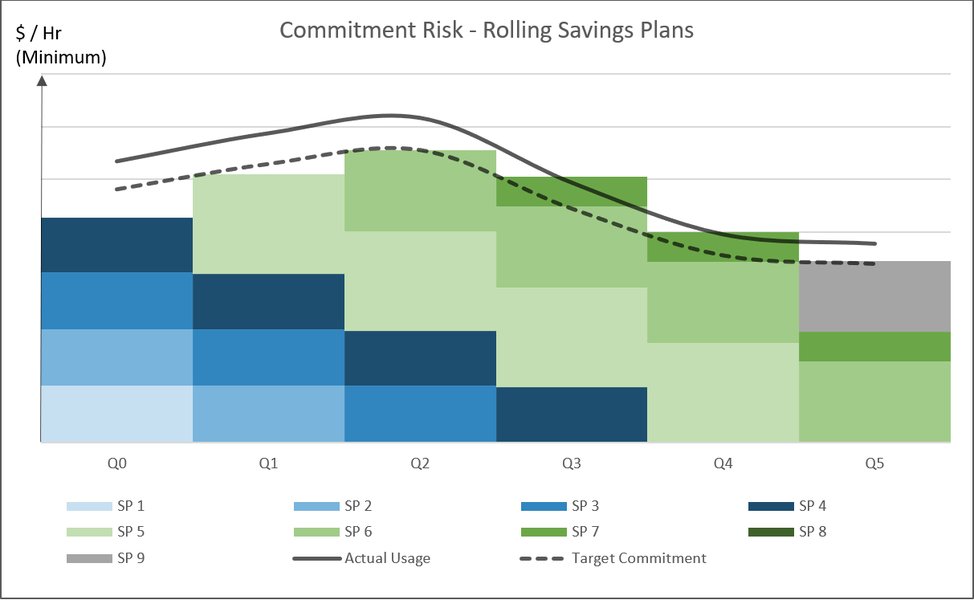
Visualizing strategies like rolling Savings Plans can be part of advanced cost optimization reporting.
Frequently Asked Questions (FAQ)
What are the essential IAM permissions for the Python script?
The script primarily needs read access to AWS Cost Explorer. Key permissions include:
ce:GetCostAndUsage: To retrieve cost and usage data.ce:GetSavingsPlansCoverage: To get data on how much of your usage is covered by Savings Plans.ce:GetSavingsPlansUtilization: To understand how much of your Savings Plan commitment is being used.- If you intend to update AWS Budgets:
budgets:UpdateBudgetandbudgets:DescribeBudgets.
How can I customize the generated chart's appearance?
Matplotlib offers extensive customization options. You can change:
- Chart types (bar, line, scatter, etc.).
- Colors, fonts, labels, and titles.
- Legends and annotations.
- Figure size and resolution.
colors list in the generate_savings_pie_chart function.
How is the "Savings Plan Savings" amount precisely calculated?
In the provided script, `EstimatedSavings` is calculated as `UnblendedCost - AmortizedCost`. `AmortizedCost` reflects the effective cost of usage after Savings Plan discounts have been applied and spread out over the term. `UnblendedCost` represents the cost calculated using public On-Demand Instance rates, without factoring in some discounts like Savings Plans or Reserved Instances. For a more detailed view, AWS Cost and Usage Reports (CUR) provide columns like `savingsPlan/SavingsPlanEffectiveCost` and `lineItem/UnblendedCost` which can be used for precise calculations. The `GetSavingsPlansUtilizationDetails` API can also offer granular data.
Can I export the report to other formats, like Excel?
Yes. The script uses `pandas`, which can easily export DataFrames to various formats. To export to Excel:
# Assuming cost_df is your pandas DataFrame
cost_df.to_excel("aws_monthly_cost_report.xlsx", index=False, sheet_name="CostData")
Recommended Further Exploration
- How can I integrate AWS Cost Explorer data with BI tools for advanced analytics?
- What are the best practices for tagging AWS resources to improve cost allocation reporting?
- How can I set up AWS Budgets alerts for proactive monitoring of Savings Plan utilization and coverage?
- What advanced Python libraries can be used to create interactive dashboards for AWS cost data?
References
 boto3.amazonaws.com
 docs.aws.amazon.com
docs.aws.amazon.com
docs.aws.amazon.com
 aws.amazon.com
docs.aws.amazon.com
docs.aws.amazon.com
docs.aws.amazon.com
docs.aws.amazon.com
docs.aws.amazon.com
docs.aws.amazon.com
docs.aws.amazon.com
docs.aws.amazon.com
docs.aws.amazon.com
docs.aws.amazon.com
aws.amazon.com
aws.amazon.com
aws.amazon.com
docs.aws.amazon.com
docs.aws.amazon.com
docs.aws.amazon.com
docs.aws.amazon.com
docs.aws.amazon.com
docs.aws.amazon.com
docs.aws.amazon.com
docs.aws.amazon.com
docs.aws.amazon.com
docs.aws.amazon.com
aws.amazon.com
Last updated May 8, 2025