
Unlock Powerful Trading Insights: Which Indicator Best Complements OBV?
Discover how combining On-Balance Volume with other tools can sharpen your market analysis and potentially improve trading outcomes.
The On-Balance Volume (OBV) indicator is a popular technical analysis tool developed by Joseph Granville. It measures buying and selling pressure as a cumulative indicator, adding volume on up days and subtracting it on down days. OBV relates price and volume to identify potential price movements based on volume flow, acting as a leading indicator. While powerful on its own, combining OBV with other indicators can provide a more robust framework for market analysis, helping to confirm signals, filter out noise, and identify higher-probability trading opportunities.
Highlights: Key Indicator Pairings with OBV
- Relative Strength Index (RSI): Often cited as the top companion, RSI complements OBV by measuring price momentum and identifying overbought/oversold conditions, crucial for confirming divergences and potential reversals.
- Moving Average Convergence Divergence (MACD): This trend-following momentum indicator works well with OBV to confirm trend strength and pinpoint potential entry/exit points through crossovers and divergences.
- Moving Averages (MAs): Simple yet effective, MAs help smooth price action and identify the underlying trend, which can be confirmed by OBV's volume flow analysis.
Why Combine Indicators with OBV?
OBV's primary strength lies in its ability to gauge underlying buying or selling pressure by tracking cumulative volume relative to price changes. A rising OBV suggests accumulation (buying pressure), potentially preceding a price increase, while a falling OBV indicates distribution (selling pressure), possibly foreshadowing a price decline. Divergences, where OBV moves contrary to price, are particularly significant signals of potential trend reversals.
However, OBV focuses solely on volume and closing price direction. It doesn't directly measure the magnitude or speed of price changes, nor does it account for volatility or explicit trend strength. Combining OBV with indicators that measure these other market dimensions can lead to more nuanced and reliable trading signals.
The Top Contender: Relative Strength Index (RSI)
Momentum Synergy and Divergence Confirmation
Across various analyses, the Relative Strength Index (RSI) consistently emerges as one of the most effective indicators to pair with OBV. RSI is a momentum oscillator that measures the speed and change of price movements, typically on a scale of 0 to 100. It helps identify overbought (usually above 70) and oversold (usually below 30) conditions.
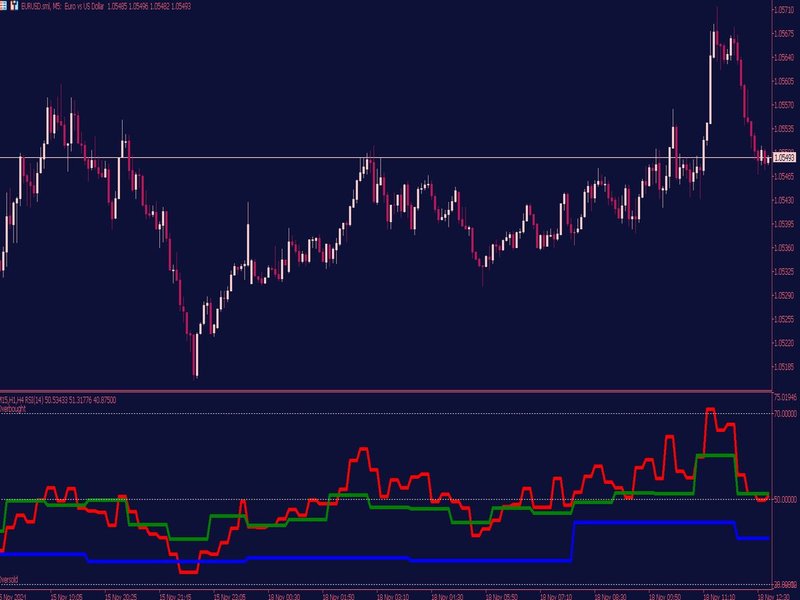
An example illustrating the Relative Strength Index (RSI) indicator on a trading chart.
Key Benefits of Combining OBV and RSI:
- Momentum Confirmation: Both OBV and RSI gauge momentum, but in different ways. OBV uses volume, while RSI uses price changes. When both indicators align (e.g., rising OBV and rising RSI above 50), it provides stronger confirmation of bullish momentum. Conversely, falling OBV and falling RSI below 50 reinforce bearish momentum.
- Divergence Analysis: This is perhaps the most powerful synergy.
- Bullish Divergence: Price makes a new low, but OBV makes a higher low (indicating volume isn't confirming the downtrend). If RSI also shows bullish divergence or is moving out of oversold territory, it strengthens the signal for a potential upward reversal.
- Bearish Divergence: Price makes a new high, but OBV makes a lower high (suggesting volume doesn't support the rally). If RSI simultaneously shows bearish divergence or enters overbought territory, it warns of a potential downward reversal. Combining divergences can help filter false signals.
- Overbought/Oversold Context: RSI's overbought/oversold levels provide context for OBV signals. For example, if OBV is rising strongly but RSI is deeply overbought (e.g., >80), it might suggest the uptrend is becoming exhausted and vulnerable to a pullback, despite positive volume flow. Conversely, an oversold RSI reading alongside a rising OBV can present a strong buy signal, indicating potential accumulation during a price dip.
Using RSI alongside OBV helps traders assess not just the *direction* of volume flow but also the *intensity* of recent price action, leading to more refined entry and exit decisions.
Other Powerful Combinations
While RSI is often favored, other indicators also offer valuable synergies with OBV, depending on the trading strategy and market conditions.
Moving Average Convergence Divergence (MACD)
Confirming Trends and Reversals
MACD is a trend-following momentum indicator that shows the relationship between two exponential moving averages (EMAs) of an asset's price. It consists of the MACD line, the signal line, and a histogram representing the difference between the two.
- Trend Confirmation: When OBV is trending upwards (indicating accumulation) and the MACD line is above the signal line and/or above zero, it confirms bullish momentum. The opposite holds true for downtrends.
- Signal Enhancement: MACD crossovers (MACD line crossing above/below the signal line) can act as buy/sell signals. Combining these with confirming OBV movements (e.g., a bullish MACD crossover accompanied by a rising OBV) increases signal reliability.
- Divergence Synergy: Similar to RSI, divergences between price and MACD can signal potential reversals. When both OBV and MACD show divergence in the same direction (e.g., price makes a new high, but both OBV and MACD make lower highs), the reversal signal is significantly stronger.
Moving Averages (MAs)
Smoothing Price and Confirming Volume Flow
Moving Averages (Simple or Exponential) smooth out price data to reveal the underlying trend direction. They can be applied to both price and the OBV line itself.
- Trend Identification: A price consistently above its MA (e.g., 50-day or 200-day MA) indicates an uptrend, while a price below suggests a downtrend. OBV should ideally move in the same direction as the price relative to its MA to confirm the trend's strength.
- OBV Moving Average Crossovers: Applying a moving average directly to the OBV line can generate signals. When OBV crosses above its MA, it can signal increasing buying pressure; crossing below suggests rising selling pressure.
- Dynamic Support/Resistance: MAs often act as dynamic support (in uptrends) or resistance (in downtrends). Monitoring OBV behavior as price approaches these levels can offer clues. For instance, if price pulls back to a key MA in an uptrend and OBV remains flat or rises, it suggests the buying pressure is resilient.
Bollinger Bands (BB)
Volatility and Breakout Analysis
Bollinger Bands consist of a middle band (typically a simple moving average) and two outer bands representing standard deviations above and below the middle band. They measure price volatility.
- Breakout Confirmation: Periods of low volatility (bands squeezing together) are often followed by periods of high volatility (bands expanding). If OBV rises significantly during a squeeze, it can signal accumulating pressure for a potential upside breakout. Conversely, falling OBV during a squeeze might precede a downside break.
- Volatility Context: When price touches the upper Bollinger Band, it might be considered overextended. If OBV confirms this with bearish divergence, a reversal is more likely. Similarly, price hitting the lower band with bullish OBV divergence can signal a potential bounce.
Average Directional Index (ADX)
Measuring Trend Strength
ADX measures the strength of a trend, regardless of its direction. Readings above 25 typically indicate a strong trend (either up or down), while readings below 20 suggest a weak or non-trending market.
- Filtering Signals: Combining OBV with ADX helps filter trades based on trend strength. In a strongly trending market (high ADX), OBV signals confirming the trend direction are more reliable. In a weak trend (low ADX), OBV divergences might be more indicative of range-bound reversals rather than major trend changes.
- Trend Confirmation: A rising ADX coupled with a rising OBV (in an uptrend) or falling OBV (in a downtrend) provides strong confirmation that the current trend has volume support and is likely to continue.
Visualizing OBV Indicator Combinations
To better understand how these indicators complement OBV, the mindmap below illustrates the primary functions each indicator adds when used in conjunction with On-Balance Volume.
Comparing Indicator Suitability with OBV
Different indicators excel in different areas when combined with OBV. The radar chart below provides a comparative analysis based on typical use cases:
This chart subjectively scores how well each indicator combination typically performs across different analytical dimensions when used with OBV. RSI and MACD score highly for divergence detection and momentum, while MAs excel at trend confirmation and ADX at trend strength.
Summary Table: OBV Indicator Combinations
This table summarizes the key indicators discussed and their primary roles when combined with OBV:
| Indicator | Primary Function with OBV | Simple Strategy Example |
|---|---|---|
| Relative Strength Index (RSI) | Confirm momentum, identify divergences, spot overbought/oversold levels. | Look for bullish divergence (lower price low, higher OBV low) confirmed by RSI moving out of oversold (<30). |
| Moving Average Convergence Divergence (MACD) | Confirm trend direction and momentum, enhance reversal signals with crossovers and divergences. | Confirm a bullish MACD crossover (MACD line crosses above signal line) with a simultaneously rising OBV. |
| Moving Averages (MAs) | Define trend direction, act as dynamic support/resistance, use OBV MA crossovers. | Confirm price holding above a key MA (e.g., 50-day) with a stable or rising OBV during pullbacks. |
| Bollinger Bands (BB) | Assess volatility, identify potential breakouts from squeezes. | Look for rising OBV during a Bollinger Band squeeze as a signal for a potential upside breakout. |
| Average Directional Index (ADX) | Measure trend strength, filter trades in weak vs. strong trends. | Prioritize OBV signals (confirming trend) when ADX is above 25, indicating a strong trend. |
| Support/Resistance Levels | Identify potential reversal points based on price action and volume changes. | Observe for significant increase/decrease in OBV as price tests a key support or resistance level. |
Visual Learning: OBV Strategies Explained
Understanding how indicators work together can often be enhanced by visual examples. The following video discusses OBV, particularly focusing on divergence signals, which are crucial when combining OBV with other indicators like RSI or MACD to spot potential entry points often used by institutional traders.
This video delves into using OBV divergence, a key technique often amplified by combining it with other confirming indicators, to identify potentially high-probability trading setups.
Frequently Asked Questions (FAQ)
Is there one single "best" indicator to always combine with OBV?
No single indicator is universally "best" in all situations. While RSI is frequently recommended due to its strong synergy with OBV for momentum and divergence analysis, the ideal combination depends on your specific trading strategy, the market conditions (trending vs. range-bound), the asset being traded, and your risk tolerance. Often, using a combination of 2-3 indicators (including OBV) provides a more robust analysis than relying on just two.
How important is divergence when combining OBV with other indicators?
Divergence is one of the most powerful signals generated by OBV, indicating a potential disagreement between price action and volume flow, often foreshadowing a trend reversal. When divergence on OBV is confirmed by a similar divergence on another momentum indicator like RSI or MACD, the signal becomes significantly more reliable. Therefore, identifying and confirming divergences is a primary reason for combining OBV with these types of indicators.
Can OBV be combined with fundamental analysis?
Yes, technical indicators like OBV and its combinations can certainly be used alongside fundamental analysis. For instance, a trader might identify a fundamentally strong company but wait for a technical buy signal, such as bullish divergence confirmed by OBV and RSI, before entering a position. This blended approach uses fundamental analysis to choose *what* to trade and technical analysis (including OBV combinations) to decide *when* to trade.
Should I use default settings for indicators combined with OBV?
Default settings (e.g., RSI(14), MACD(12,26,9)) are a good starting point, but experienced traders often adjust parameters based on the asset's volatility and the timeframe they are trading. Backtesting different settings on historical data for your specific market and timeframe is recommended to find parameters that might yield better results for your strategy when combined with OBV.
References
- OBV Indicator: Calculation, Formula & Trading Strategies [2024] - Liberated Stock Trader
- OBV Indicator (On Balance Volume) + RSI = Comprehensive Market Analysis - The Robust Trader
- This Is What Happens When You Combine The OBV and RSI Indicators - Medium
- On Balance Volume (OBV) - Alchemy Markets
- On Balance Volume (OBV) - Fidelity
- Combining OBV Divergence with Other Indicators - FasterCapital
Recommended
Last updated April 17, 2025