
Unlocking Weekly Options: Which Indicator Reigns Supreme for Liquid, Volatile Stocks?
Navigate fast-moving markets with the right tools for short-term options trading success.
Trading weekly options on stocks known for both high liquidity and significant volatility presents a unique challenge. You need indicators that can swiftly identify potential opportunities and manage risk in fast-paced environments. While the quest for a single "best" indicator is common, seasoned traders often rely on a combination of tools to gain a comprehensive market view.
Key Insights for Weekly Options Traders
- No Silver Bullet: A single indicator rarely provides a complete picture, especially for complex scenarios like weekly options on volatile stocks.
- Focus on Volatility & Confirmation: Prioritize indicators that measure volatility (like Bollinger Bands, ATR) and combine them with tools that confirm momentum or trend strength (like RSI, ADX/MFI, Moving Averages).
- The Power of Combination: Using multiple, complementary indicators offers a more robust signaling system, helping to filter out noise and improve decision-making accuracy.
Understanding the Weekly Options Arena
Why Standard Approaches Need Adjustment
Weekly options have very short lifespans, meaning time decay (theta) works against buyers rapidly. Volatile stocks can experience large price swings within hours or days. Liquidity is essential for entering and exiting trades efficiently with minimal slippage. Therefore, indicators must be sensitive enough to capture short-term movements and provide timely signals.
Key Challenges:
- Rapid Time Decay (Theta): The value of an option erodes quickly as expiration approaches, demanding precise entry and exit timing.
- Sharp Price Swings: Volatility creates opportunities but also increases risk. Indicators must help differentiate genuine moves from market noise.
- Need for Speed: Signals must be generated quickly enough to act upon within the short timeframe of weekly options.
Top Technical Indicators for Your Weekly Options Toolkit
Based on analyses and common trading practices, several indicators consistently emerge as valuable for navigating weekly options on liquid, volatile stocks. Here’s a breakdown of the most effective ones:
Gauging Market Volatility
Bollinger Bands (BB)
Bollinger Bands are a cornerstone for volatility analysis. They consist of a central moving average (typically 20-period SMA) and two outer bands plotted standard deviations away. The width between the bands visually represents volatility – widening suggests increasing volatility, while narrowing ("squeezing") indicates decreasing volatility, often preceding a significant price move. For weekly options:
- Signals: Look for price touching or exceeding the outer bands (potential overbought/oversold conditions) or breakouts after a band squeeze.
- Relevance: Directly visualizes volatility levels, crucial for volatile stock assessment.
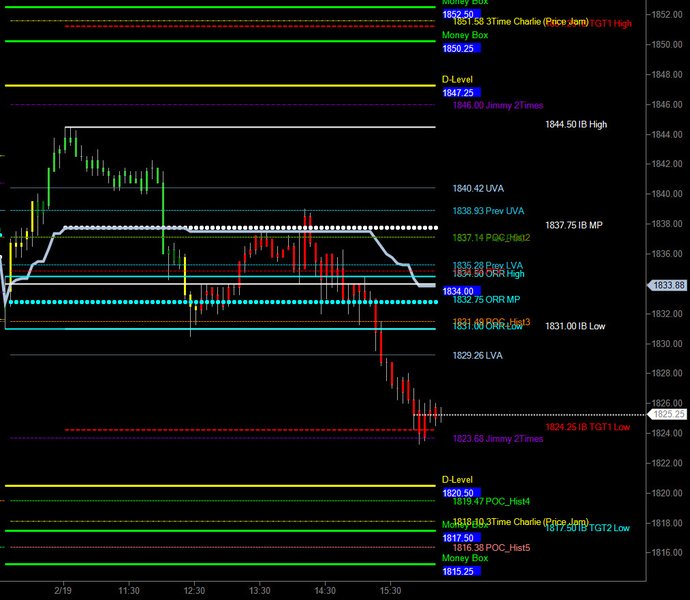
Example of a trading chart interface displaying various technical indicators.
Average True Range (ATR)
ATR measures the average range of price movement over a specific period (often 14 days). It doesn't indicate direction, but quantifies the *degree* of price volatility. A rising ATR signals increasing volatility, while a falling ATR suggests decreasing volatility.
- Signals: Use ATR primarily for risk management – setting stop-loss levels (e.g., 1-2 ATR below entry for longs) and determining appropriate position sizes based on expected price fluctuation.
- Relevance: Essential for managing risk in volatile stocks by providing an objective measure of potential price swings.
Confirming Momentum and Trend
Relative Strength Index (RSI)
RSI is a momentum oscillator measuring the speed and change of price movements on a scale of 0 to 100. It helps identify potentially overbought (typically >70) or oversold (<30) conditions.
- Signals: Look for readings entering overbought/oversold zones (potential reversal points) or divergences (price makes a new high/low, but RSI fails to confirm, signaling weakening momentum).
- Relevance: Helps time entries and exits by gauging momentum exhaustion, useful in volatile markets where reversals can be sharp.
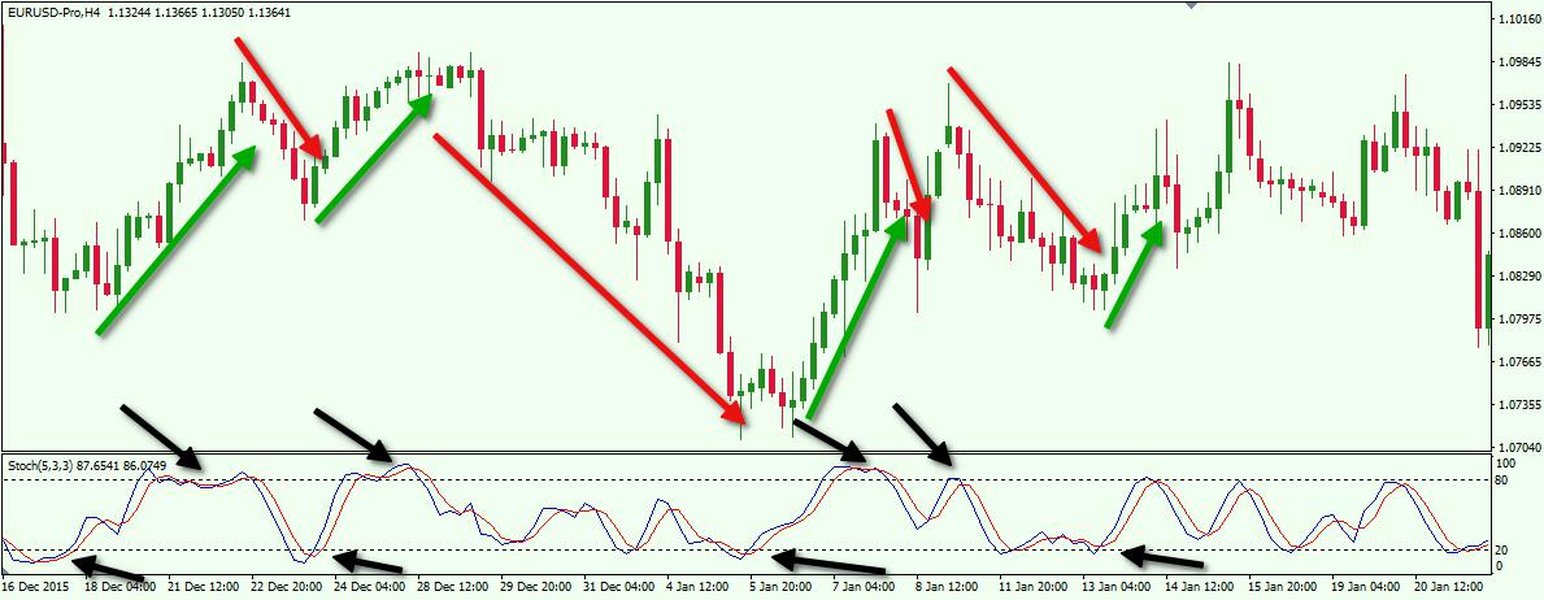
Example chart illustrating an oscillator (Stochastic, conceptually similar to RSI) indicating potential overbought/oversold levels.
Average Directional Index (ADX) with Money Flow Index (MFI)
This combination is cited as a strong performer for identifying entry points in weekly options strategies. ADX measures trend *strength* (not direction), with readings above 25 often indicating a strong trend. MFI incorporates price and volume to measure buying and selling pressure (money flow).
- Signals: A potential strategy involves entering trades when ADX is rising (or above 25), MFI confirms money flow in the desired direction, and price action aligns with specific moving average criteria (e.g., price above 50-day MA, 5-day MA above 20-day MA for calls).
- Relevance: Powerful for confirming both the strength and the backing (money flow) behind a potential move, increasing confidence in trade entries.
Moving Averages (EMA/SMA)
Simple Moving Averages (SMA) and Exponential Moving Averages (EMA) smooth out price action to identify the underlying trend direction. EMAs give more weight to recent prices, making them potentially more responsive for short-term trading.
- Signals: Crossovers (e.g., a shorter-term MA like 9-EMA crossing above a longer-term MA like 20-SMA) can signal trend changes. Price action relative to key MAs (like the 50-day or 200-day) provides context for the overall trend.
- Relevance: Fundamental for establishing trend direction, acting as dynamic support/resistance levels, and providing baseline context for other indicators.
Visualizing Indicator Relationships
Understanding how these indicators relate to the goal of trading weekly options on liquid, volatile stocks is key. The following mindmap illustrates these connections:
(Liquid & Volatile Stocks)"] id1["Goal: Identify Short-Term Opportunities & Manage Risk"] id2["Key Indicator Categories"] id3["Volatility Measurement"] id3a["Bollinger Bands (BB)"] id3b["Average True Range (ATR)"] id4["Momentum & Confirmation"] id4a["Relative Strength Index (RSI)"] id4b["ADX / MFI Combo"] id4c["Moving Averages (EMA/SMA)"] id5["Volume Analysis (Implied)"] id5a["Money Flow Index (MFI)"] id6["Strategy Considerations"] id6a["Combine Indicators"] id6b["Use Short Timeframes (5-15 min)"] id6c["Risk Management (ATR Stops)"] id6d["Focus on Liquid Stocks (SPY, QQQ, etc.)"]
Comparing Indicator Strengths
No single indicator excels at everything. This chart provides a comparative view of how the top contenders perform across different dimensions relevant to weekly options trading on volatile, liquid stocks. Scores are subjective estimates based on common usage and strengths:
This comparison highlights how different indicators offer strengths in specific areas. Bollinger Bands and ATR excel at volatility assessment and risk management, while RSI and ADX/MFI provide stronger momentum and trend confirmation signals. Moving averages offer clarity in trend direction.
Indicator Summary for Weekly Options
This table provides a quick reference for the primary roles and signals of the key indicators discussed, specifically in the context of trading weekly options on liquid, volatile stocks:
| Indicator | Primary Use Case (Weekly Options) | Example Signal |
|---|---|---|
| Bollinger Bands | Assess current volatility; Identify potential breakouts/reversals | Price breaks above upper band after a tight squeeze (potential bullish breakout) |
| Average True Range (ATR) | Measure volatility magnitude; Set stop-loss levels; Size positions | ATR value increases significantly (signals rising volatility, adjust stop placement) |
| Relative Strength Index (RSI) | Identify overbought/oversold conditions; Spot momentum divergence | RSI drops below 30 and starts rising (potential oversold bounce opportunity) |
| ADX / MFI Combo | Confirm trend strength and money flow supporting the move | ADX > 25, MFI shows strong inflow, price confirms bullish MA setup (strong buy signal) |
| Moving Averages (EMA/SMA) | Determine short-term trend direction; Identify dynamic support/resistance | 9-EMA crosses above 20-SMA on a 15-min chart (potential start of uptrend) |
Why a Combination Approach Wins
Synergy Over Silos
Relying on a single indicator is like navigating with only one instrument – you might miss crucial context. Combining indicators creates a more robust system:
- Confirmation: One indicator can confirm the signal of another. For example, an RSI oversold reading gains significance if the price is simultaneously touching the lower Bollinger Band.
- Filtering Noise: Volatile markets generate many false signals. Requiring signals from multiple, complementary indicators helps filter out noise and focus on higher-probability setups.
- Context: Volatility indicators like BB or ATR set the stage, defining the market environment. Momentum and trend indicators like RSI, ADX/MFI, or MAs then provide specific entry and exit signals within that context.
Insights from Trading Experts
Many experienced traders share insights on using indicators effectively. This video discusses technical indicators relevant to options trading, offering perspectives you might find useful:
This video explores various technical indicators commonly used by options traders. It delves into how tools like moving averages, RSI, and potentially others can be applied to analyze stock charts for setting up options trades. Understanding these concepts can help refine your approach to selecting and combining indicators for your specific strategy involving weekly options on liquid, volatile stocks.
Practical Application: Putting It Together
Building Your Weekly Options Strategy
Instead of searching for the single "best" indicator, focus on building a strategy that incorporates several complementary tools:
- Select Your Core Indicators: Choose 2-4 indicators covering volatility, momentum, and trend (e.g., Bollinger Bands + RSI + ADX).
- Define Entry/Exit Rules: Specify the exact conditions across your chosen indicators that trigger a trade entry or exit. Be precise (e.g., "Enter call when price closes above 20-SMA, RSI crosses above 50, and ADX is above 20").
- Match Timeframes: Use shorter chart timeframes (e.g., 5-minute, 15-minute) that align with the short duration of weekly options.
- Incorporate Risk Management: Always use tools like ATR to set appropriate stop-losses and manage position size based on current volatility.
- Backtest and Refine: Test your strategy on historical data for the types of liquid, volatile stocks you intend to trade (e.g., SPY, QQQ, AAPL, AMZN) before risking real capital.
Remember the findings suggesting the ADX/MFI combination performs well, especially when layered with moving average criteria (e.g., underlying above 50-day MA, 5-day MA above 20-day MA for bullish entries). This provides a solid starting point for developing a multi-indicator strategy.
Frequently Asked Questions (FAQ)
+ Can I really just use one indicator for weekly options?
+ What chart timeframe is best for weekly options?
+ How important is volume or open interest when using indicators?
+ Which specific combination of indicators is considered best?
References
- 14 Best Indicators for Options Trading You Must Use - Strike
- The Top Technical Indicators for Options Trading - Investopedia
- Technical Study - Best indicators for entering weekly options trades - Reddit
- Best Indicators for Options Trading - Lakshmishree Investment & Securities Pvt. Ltd.
- Complete Guide To Volatility Indicators - Yahoo Finance
- Best Indicators for Options Trading | Tradetron Blog
Recommended Reading
Last updated April 17, 2025