
Top Moodle Plugins for Comprehensive Reporting and Insights
Enhance your Moodle analytics with these robust reporting tools
Key Takeaways
- Comprehensive Analytics Capabilities: Choose plugins that offer extensive reporting features to capture all necessary insights.
- Customization and Flexibility: Opt for solutions that allow tailored reports to meet specific institutional needs.
- User-Friendly Interfaces and Seamless Integration: Ensure the plugin integrates smoothly with Moodle and provides an intuitive user experience.
1. IntelliBoard: The Premier Choice for Moodle Analytics
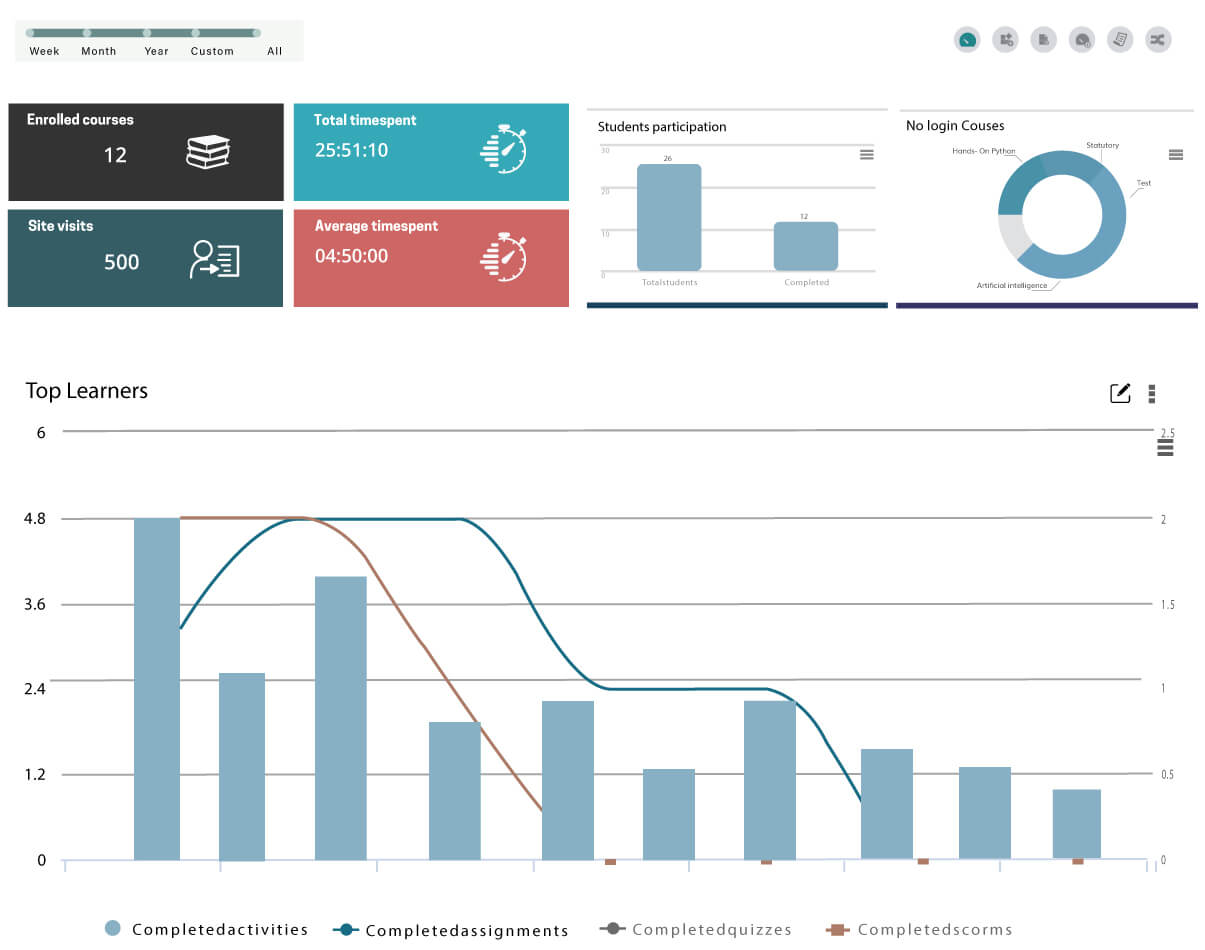
IntelliBoard stands out as a leading Moodle reporting plugin, offering a comprehensive suite of analytics tools designed to provide deep insights into learner performance and engagement. Its robust features make it an ideal replacement for Edwiser Reports, especially for institutions seeking a reliable and feature-rich solution.
Features of IntelliBoard
- Real-Time Dashboards: Monitor ongoing activities and performance metrics with up-to-the-minute data.
- Customizable Reports: Tailor reports to meet the specific needs of different stakeholders, including administrators, teachers, and learners.
- Over 50 Built-In Dashboards: Access a wide range of pre-configured dashboards that cater to various analytical needs without the need for extensive setup.
- Seamless Integration: Easily integrates with Moodle, minimizing the need for custom coding and ensuring a smooth implementation process.
- Cross-Platform Compatibility: Integrates with over 10 leading learning platforms, allowing for consolidated data analysis across different systems.
Pros and Cons
| Pros | Cons |
|---|---|
| Comprehensive reporting features | Requires significant investment |
| Real-time data updates | May have a steep learning curve for new users |
| Highly customizable dashboards | Ongoing subscription costs |
Why Choose IntelliBoard?
IntelliBoard is particularly suitable for institutions that require detailed and customizable analytics without compromising on the depth of insights. Its ability to integrate seamlessly with multiple platforms and provide real-time data makes it a valuable tool for enhancing learning outcomes and operational efficiency.
2. Zoola Analytics Reporting: Comprehensive Insights for Moodle
Zoola Analytics Reporting offers a 360-degree view of Moodle activities, enabling institutions to generate a wide array of reports that cover course completion, learner progress, enrollment statistics, and more. It is recognized for its thorough analytics capabilities, making it a strong contender for those seeking an alternative to Edwiser Reports.
Features of Zoola Analytics Reporting
- Wide Range of Reports: Generate detailed reports on various aspects such as course completion rates, learner engagement, and feedback.
- Comprehensive Analytics: Provides in-depth analysis to help understand learner behaviors and course effectiveness.
- User-Friendly Interface: Designed for ease of use, allowing administrators and educators to navigate and utilize the tool efficiently.
Pros and Cons
| Pros | Cons |
|---|---|
| Extensive reporting options | Higher cost compared to some alternatives |
| Intuitive user interface | Customer support could be improved |
| Detailed learner insights | May require initial setup time |
Why Choose Zoola Analytics Reporting?
Zoola Analytics Reporting is ideal for institutions that need a holistic view of their Moodle environment. Its ability to generate a diverse range of reports ensures that administrators can track and analyze multiple facets of their e-learning programs effectively.
3. Configurable Reports Plugin: Flexibility at Its Core
The Configurable Reports Plugin offers unmatched flexibility, allowing users to create custom reports without requiring in-depth SQL knowledge. This makes it an excellent choice for institutions that need tailored reporting solutions to meet specific analytical requirements.
Features of Configurable Reports Plugin
- Custom Report Creation: Build reports tailored to specific needs without the necessity of advanced technical skills.
- Diverse Report Types: Generate course reports, category reports, timeline reports, and even custom SQL-based reports.
- User Access Control: Manage who can view and generate specific reports, ensuring data security and privacy.
- Export Capabilities: Easily export reports for further analysis or sharing with stakeholders.
Pros and Cons
| Pros | Cons |
|---|---|
| Highly customizable reporting options | Requires some familiarity with Moodle's database structure for advanced reports |
| No need for SQL knowledge for basic reports | Performance can be impacted with highly complex reports |
| Effective user access management | Initial setup may be time-consuming |
Why Choose Configurable Reports Plugin?
This plugin is suitable for institutions that prioritize customization and need specific reports that standard plugins may not offer. Its versatility ensures that users can extract meaningful data tailored to their unique requirements without extensive technical overhead.
4. LearnerScript: Open-Source Flexibility
LearnerScript is an open-source reporting solution that provides over 80 ready-to-use reports, making it an attractive option for institutions that prefer customizable, on-premise solutions. Its extensive report library and responsive design cater to diverse reporting needs.
Features of LearnerScript
- Extensive Report Library: Access to over 80 pre-built reports covering various aspects of Moodle usage and learner engagement.
- Complete Customization: Modify existing reports or create new ones to align with specific institutional requirements.
- Responsive Design: Ensures reports are accessible and readable across different devices and screen sizes.
- Open-Source Flexibility: Freedom to modify and extend functionalities without licensing constraints.
Pros and Cons
| Pros | Cons |
|---|---|
| Highly customizable and flexible | Requires technical expertise for setup and customization |
| Large library of pre-built reports | High one-time purchase fee |
| Open-source nature allows for extensive modifications | Support may be limited compared to proprietary solutions |
Why Choose LearnerScript?
LearnerScript is perfect for institutions that seek a highly customizable and extensible reporting solution. Its open-source foundation allows for deep integrations and bespoke reporting capabilities, making it a valuable tool for those with specific and evolving analytical needs.
5. Analytics Graphs: Visual Insights for Educators
The Analytics Graphs Block plugin is designed to provide teachers with visual tools to identify student profiles and make informed pedagogical decisions. Its focus on graphical representations makes data interpretation more intuitive and actionable.
Features of Analytics Graphs
- Diverse Graph Types: Generate five different types of graphs to visualize various learner metrics.
- Interactive Data: Allows users to zoom into graph data for more detailed analysis.
- Communication Tools: Enables teachers to send messages to students based on insights gleaned from the graphs.
- Ease of Use: User-friendly interface ensures that educators can quickly generate and interpret graphs without extensive training.
Pros and Cons
| Pros | Cons |
|---|---|
| Facilitates easy data visualization | Limited to specific types of graphs |
| Enhances communication with students | May not offer comprehensive reporting features |
| Intuitive and user-friendly | Less suitable for deep data analysis |
Why Choose Analytics Graphs?
Analytics Graphs is ideal for educators who require straightforward and visually appealing data representations to inform their teaching strategies. Its ability to facilitate direct communication with students based on analytical insights adds an additional layer of functionality that supports personalized learning.
6. Configuring Events Graphic Report for Enhanced Visualization
The Events Graphic Report plugin leverages the Google Charts API to provide visual representations of course and user activities within Moodle. This plugin is essential for administrators looking to understand the dynamics of course interactions and user behaviors through graphical data.
Features of Events Graphic Report
- Google Charts Integration: Utilizes the powerful Google Charts API to generate interactive and customizable graphs.
- Course and User Activity Visualization: Offers visual insights into how courses are being utilized and how users are engaging with the content.
- Easy Browsing: Allows administrators to browse graphics by course, making it simpler to pinpoint specific areas of interest.
- Frequent Event Tracking: Identifies the most common events, aiding in the understanding of course dynamics and user interactions.
Pros and Cons
| Pros | Cons |
|---|---|
| Interactive and customizable charts | Dependent on Google Charts API availability |
| Easy to navigate and interpret | May require initial configuration |
| Provides clear visual insights into course activities | Limited to events-based reporting |
Why Choose Events Graphic Report?
For administrators seeking to visualize event-based data within Moodle, the Events Graphic Report plugin offers a straightforward and effective solution. Its integration with Google Charts ensures high-quality, interactive visualizations that can enhance the understanding of course and user dynamics.
7. Overview Statistics: Comprehensive Usage Insights
The Overview Statistics plugin provides administrators with a variety of charts related to site and course usage. This plugin is valuable for gaining a broad understanding of Moodle’s performance and user interactions across different metrics.
Features of Overview Statistics
- Multiple Report Types: Offers a range of site and course report charts to monitor different aspects of Moodle usage.
- Powerful Data Insights: Empowers administrators to make informed decisions based on comprehensive usage statistics.
- User-Friendly Interface: Designed for ease of use, allowing for quick access to essential data without complex navigation.
Pros and Cons
| Pros | Cons |
|---|---|
| Wide variety of usage reports | Limited advanced analytics features |
| Easy to interpret data visualizations | May not cater to highly specialized reporting needs |
| Intuitive and accessible interface | Performance may vary with large datasets |
Why Choose Overview Statistics?
Overview Statistics is ideal for institutions that require a broad overview of Moodle usage without delving into overly complex analytics. Its diverse range of reports provides a solid foundation for understanding overall platform performance and user engagement.
8. Growth Report: Tracking Moodle’s Evolution
The Growth Report plugin is essential for administrators interested in monitoring the historical growth and evolution of their Moodle installation. By providing data on user numbers, activities, and certificates over time, it helps in tracking long-term trends and assessing platform scalability.
Features of Growth Report
- Historical Data Tracking: Monitors growth over the years, providing insights into long-term trends.
- Growth Curves: Visual representations of the increase in activities, users, and certificates.
- Site and Category Level Analysis: Offers detailed growth data at both the overall site level and within specific categories.
- Trend Analysis: Helps administrators understand the scalability and adoption patterns of their Moodle environment.
Pros and Cons
| Pros | Cons |
|---|---|
| Detailed historical growth data | Limited to growth-related metrics |
| Helps in strategic planning and forecasting | May not provide real-time insights |
| Easy to interpret growth curves | Requires regular data updates for accuracy |
Why Choose Growth Report?
Growth Report is perfect for institutions that need to monitor and analyze the expansion and scalability of their Moodle environments over time. Its focus on historical data makes it a valuable tool for strategic planning and long-term decision-making.
9. Course Usage Statistics: Free and Focused
The Course Usage Statistics plugin is a free solution that measures how courses are utilized by both students and teachers. While it offers more limited reporting capabilities compared to other premium plugins, it serves as a cost-effective option for institutions with basic reporting needs.
Features of Course Usage Statistics
- Usage Pattern Analysis: Tracks how courses are accessed and interacted with by users.
- Basic Reporting: Provides essential insights into course engagement without overwhelming complexity.
- Free Availability: Being a free plugin makes it accessible for institutions with tight budgets.
Pros and Cons
| Pros | Cons |
|---|---|
| Cost-effective solution | Limited to basic reporting functionalities |
| Easy to install and use | May not meet the needs of larger institutions with complex reporting requirements |
| Focuses on course usage patterns | Lacks advanced analytics and visualization features |
Why Choose Course Usage Statistics?
For institutions seeking a no-cost solution to monitor basic course usage, the Course Usage Statistics plugin offers a straightforward and efficient way to gain insights into how their courses are being utilized without incurring additional expenses.
10. Ad-hoc Reporting and Custom Development
Sometimes, off-the-shelf plugins may not fully align with an institution's unique reporting needs. In such cases, ad-hoc reporting or custom development can offer tailored solutions that precisely fit specific requirements. This approach ensures that all analytical needs are met without the constraints of existing plugins.
Advantages of Custom Reporting Solutions
- Tailored Solutions: Develop reports that are specifically designed to meet the institution's unique data and insight requirements.
- Flexibility: Modify and adapt reports as the institution's needs evolve over time.
- Integration: Seamlessly integrate with existing systems and workflows without the limitations of generic plugins.
Considerations for Custom Development
-
Resource Investment: Custom solutions require time, expertise, and financial resources to develop and maintain.
-
Technical Expertise: Institutions need access to developers or technical staff capable of creating and managing custom reports.
-
Ongoing Maintenance: Ensuring that custom reports remain functional and up-to-date with Moodle’s updates requires continuous maintenance efforts.
Why Choose Custom Development?
Custom development is ideal for institutions with specific and complex reporting needs that cannot be adequately addressed by existing plugins. While it demands more resources, the resulting solutions are precisely aligned with the institution’s objectives and data analysis requirements.
Comparison of Top Moodle Reporting Plugins
| Plugin | Key Features | Pros | Cons | Pricing |
|---|---|---|---|---|
| IntelliBoard | Real-time dashboards, customizable reports, 50+ built-in dashboards | Comprehensive, real-time data, seamless integration | High investment cost, steep learning curve | Subscription-based |
| Zoola Analytics Reporting | Wide range of reports, comprehensive analytics, user-friendly interface | Extensive reporting, intuitive UI, detailed insights | Higher cost, customer support could improve | Subscription-based |
| Configurable Reports Plugin | Custom report creation, diverse report types, user access control | Highly customizable, no SQL needed for basic reports | May impact performance, requires Moodle database familiarity for advanced reports | Free and premium options available |
| LearnerScript | 80+ ready-to-use reports, complete customization, responsive design | Extensive report library, open-source flexibility | High initial cost, requires technical expertise | One-time purchase fee |
| Analytics Graphs | Diverse graph types, interactive data, communication tools | Easy data visualization, enhances communication | Limited to specific graph types, less comprehensive | Free |
| Growth Report | Historical growth data, growth curves, trend analysis | Detailed growth tracking, aids strategic planning | Limited to growth metrics, not real-time | Free |
| Course Usage Statistics | Usage pattern analysis, basic reporting, free access | Cost-effective, easy to use | Basic functionalities, lacks advanced features | Free |
Conclusion
Selecting the optimal Moodle plugin for generating reports and graphs hinges on the specific needs and resources of your institution. For those seeking a comprehensive and feature-rich solution, IntelliBoard emerges as the top choice, offering extensive analytics and seamless integration capabilities. If customization without extensive technical expertise is a priority, the Configurable Reports Plugin provides the necessary flexibility to create tailored reports. Institutions with open-source preferences and the ability to invest in customization may find LearnerScript to be the ideal fit, thanks to its extensive report library and adaptable nature.
For educators focusing on visual insights and enhancing communication with students, the Analytics Graphs plugin offers an intuitive and interactive way to interpret data. Meanwhile, tools like Zoola Analytics Reporting and Growth Report provide specialized insights that cater to different aspects of Moodle usage, from comprehensive data analytics to historical growth tracking.
Ultimately, the best approach involves assessing your institution's specific reporting requirements, budget constraints, and technical capabilities to choose a plugin that not only meets your current needs but also scales with your future objectives.
References
Last updated February 8, 2025