
Unlock Your Data's Potential: The Ultimate Drag-and-Drop Form Builder with Visualization Tools
Transform data collection and analysis without writing code - the best platforms for 2025 revealed
Essential Insights for No-Code Form Building with Visualization
- Integrated platforms like Knack and Visme offer the strongest combination of drag-and-drop form building and native data visualization capabilities
- Specialized form builders (Jotform, Tally) provide superior form experiences but often require integration with third-party visualization tools
- Low-code platforms with database foundations (Airtable, Caspio) offer the most scalable solutions for complex data relationships and advanced visualizations
Understanding No-Code Form Builders with Visualization Capabilities
Creating a form builder with integrated data visualization has become increasingly accessible thanks to no-code and low-code platforms. These solutions eliminate the need for programming expertise while providing powerful tools to collect, process, and visualize data effectively.
The ideal platform should combine an intuitive drag-and-drop interface for form creation with robust data visualization capabilities, allowing you to transform collected data into actionable insights through charts, graphs, and interactive dashboards.
All-in-One Solutions vs. Specialized Tools
When choosing a platform, you'll generally encounter two categories:
- All-in-One Platforms: These offer both form building and data visualization features within a single ecosystem, providing seamless integration but sometimes with less specialized capabilities in either area.
- Specialized Form Builders with Integrations: These excel at form creation but rely on third-party tools or integrations for data visualization, offering more flexibility but potentially more complex setup.
Top All-in-One Platforms for Form Building and Data Visualization
1. Knack
Knack stands out as a powerful no-code database application builder that combines form creation with visualization capabilities. It enables teams to build applications that harness data, automate processes, and move workflows online without coding.
Key Features:
- Intuitive drag-and-drop interface for building custom forms
- Built-in display options for visualizing collected data
- Database functionality for managing complex data relationships
- Customizable dashboards for real-time data analysis
- Automation tools to streamline workflows
2. Visme
Visme offers a comprehensive solution that excels in visual content creation, including form building with strong data visualization capabilities. It's particularly well-suited for users who prioritize aesthetics and engaging visual representations of data.
Key Features:
- Drag-and-drop interface for creating visually appealing forms
- Advanced tools for transforming data into engaging visuals
- Extensive template library for forms and data visualizations
- Collaboration features for team-based projects
- Strong branding and customization options
3. Airtable
While not a traditional form builder, Airtable combines the functionality of a spreadsheet and a database, allowing you to create forms for data collection and then visualize that data through various views and integrations.
Key Features:
- Form interface for data collection that feeds directly into a database
- Multiple visualization options (Kanban, calendar, gallery, etc.)
- Relational database capabilities for complex data models
- Rich ecosystem of integrations and extensions
- Automations to connect form submissions with other workflows
Specialized Form Builders with Visualization Capabilities
1. Jotform
Jotform excels as a dedicated form builder with extensive customization options and integration capabilities. While its primary strength lies in form creation, it offers reporting tools and integrates with various data visualization platforms.
Key Features:
- Powerful drag-and-drop form builder with 10,000+ templates
- Built-in form analytics and reporting
- Integration with 150+ third-party tools and services
- Payment processing capabilities (30+ payment gateways)
- Conditional logic and widget features
2. Tally
Tally is a free online form builder that stands out for its simplicity and zero-cost approach. While it lacks native advanced visualization tools, it can be paired with various data visualization platforms through third-party integrations.
Key Features:
- Free plan with unlimited forms and submissions
- Clean, intuitive drag-and-drop interface
- Simple data export options
- Basic analytics for form performance
- Integration capabilities with other tools
3. DronaHQ
DronaHQ offers a low-code form builder with strong capabilities to enable users to build interactive forms that can run across devices. It features customizable templates and integrates well with data visualization tools.
Key Features:
- Cross-platform form building capabilities
- Extensive integration options
- Conditional logic and form rules
- Built-in analytics and reporting
- Database connectivity for data management
Low-Code Platforms with Database and Visualization Capabilities
1. Caspio
Caspio is a leading low-code platform for building online database applications without writing code. It offers powerful form creation tools along with data visualization capabilities, making it ideal for business applications requiring both data collection and analysis.
Key Features:
- Database-centric application development
- Form builder with validation and customization options
- Charts, graphs, and dashboard capabilities
- Enterprise-grade security features
- Scalable architecture for growing applications
2. TrackVia
TrackVia's low-code platform helps turn processes into apps that automate tasks, streamline work, and centralize data. It includes strong form-building capabilities and data visualization tools for comprehensive business applications.
Key Features:
- Drag-and-drop app and form builder
- Workflow automation tools
- Integrated reporting and analytics
- Mobile data collection capabilities
- Enterprise integration options
Feature Comparison of Top Platforms
| Platform | Form Building | Data Visualization | Integration Options | Pricing Model | Best For |
|---|---|---|---|---|---|
| Knack | Advanced | Strong (Native) | Moderate | Subscription-based | Database-driven applications |
| Visme | Good | Excellent (Native) | Limited | $29/month+ | Visual-focused applications |
| Airtable | Moderate | Good (Native views) | Excellent | Freemium | Flexible data management |
| Jotform | Excellent | Basic (Some integrations) | Extensive (150+) | $34/month+ | Form-centric applications |
| Tally | Good | Limited (Requires integration) | Moderate | Free | Simple, free form solutions |
| Caspio | Advanced | Strong (Native) | Good | Subscription-based | Enterprise applications |
Platform Capabilities Comparison
To help you visualize how these platforms compare across key dimensions, here's a radar chart showing their relative strengths:
No-Code Form Building Ecosystem
Understanding the ecosystem of no-code form building and data visualization tools can help you make a more informed decision. Here's a mindmap that shows how these tools relate to each other and the broader no-code landscape:
& Data Visualization"] id1["All-in-One Solutions"] id1-1["Knack"] id1-1-1["Database-driven"] id1-1-2["Built-in visualizations"] id1-2["Visme"] id1-2-1["Visual focus"] id1-2-2["Design-oriented"] id1-3["Airtable"] id1-3-1["Spreadsheet interface"] id1-3-2["Multiple views"] id2["Form Specialists"] id2-1["Jotform"] id2-1-1["Extensive templates"] id2-1-2["Third-party integrations"] id2-2["Tally"] id2-2-1["Free option"] id2-2-2["Simplicity"] id2-3["DronaHQ"] id2-3-1["Cross-platform"] id2-3-2["Enterprise features"] id3["Low-Code Platforms"] id3-1["Caspio"] id3-1-1["Database foundation"] id3-1-2["Enterprise scalability"] id3-2["TrackVia"] id3-2-1["Process automation"] id3-2-2["Workflow integration"] id4["Visualization Tools"] id4-1["Power BI"] id4-1-1["Microsoft ecosystem"] id4-2["Tableau"] id4-2-1["Advanced analytics"] id4-3["Looker"] id4-3-1["Google ecosystem"]
Visual Comparison of Form Builders
Here are some visual examples of the leading form builders with data visualization capabilities:
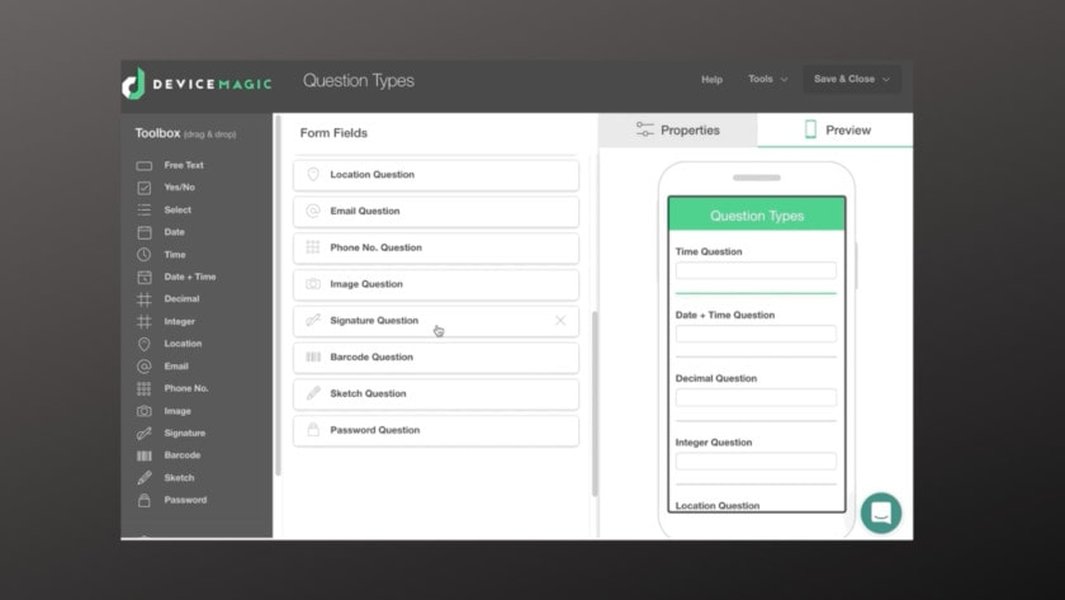
Example of a typical drag-and-drop form builder interface
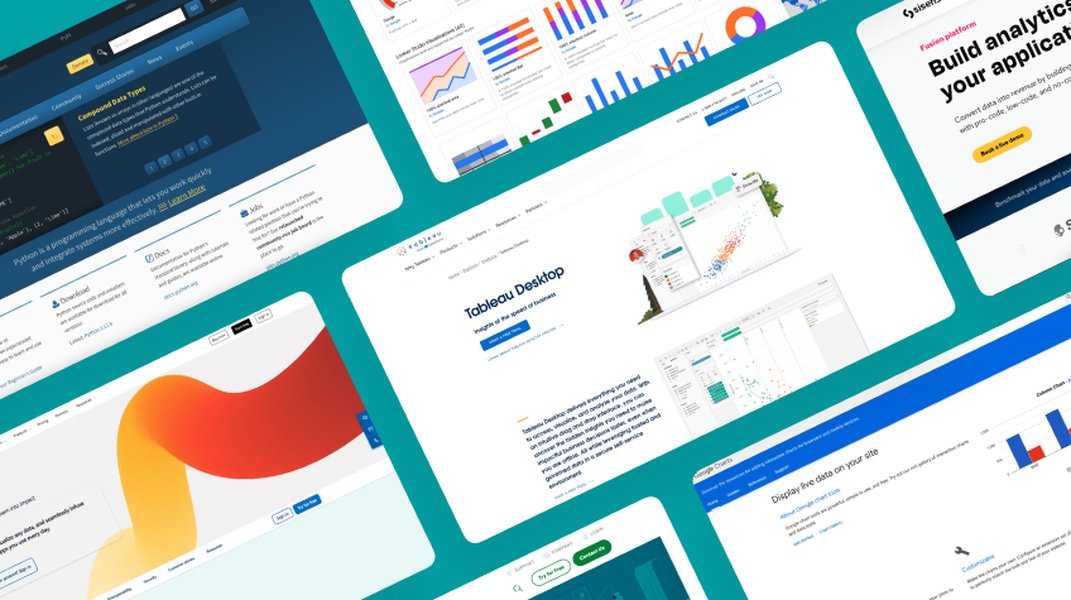
Various data visualization capabilities available in modern platforms
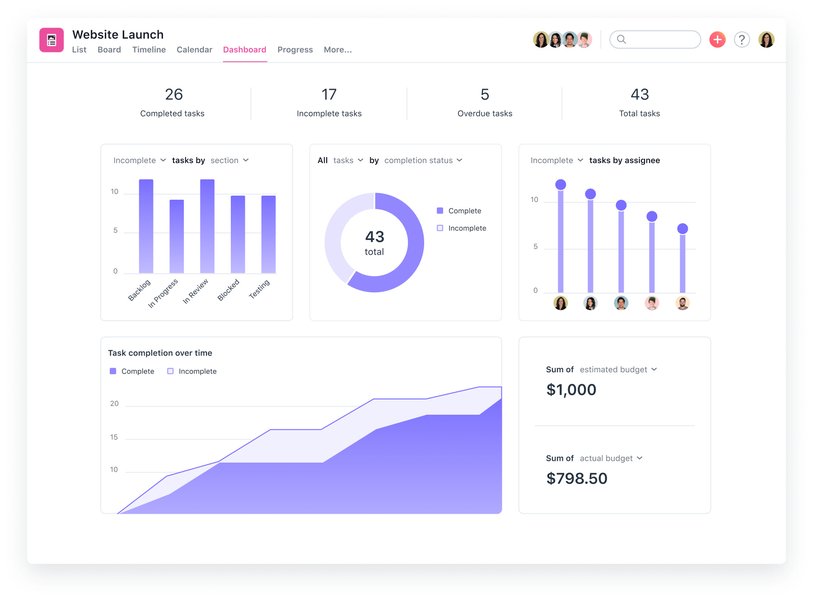
Example of dashboard visualization for form data
Expert Video Demonstration
This video provides an excellent overview of data visualization tools that can work with your form builder, including specific demonstrations of how they handle different types of data:
The video covers several powerful options, including Microsoft Power BI, Tableau Desktop, and Visme, showing their capabilities for visualizing data collected through forms.
Making Your Decision: Key Considerations
When selecting the best platform for your needs, consider these critical factors:
1. Data Complexity
Consider the complexity of the data you'll be collecting and how you want to visualize it. Platforms like Knack and Caspio excel with complex data relationships, while Visme might be better for straightforward visual representations.
2. Technical Expertise
Assess your team's technical capabilities. While all these platforms are no-code or low-code, some (like Caspio) have a steeper learning curve than others (like Tally).
3. Integration Requirements
If you need to connect your form builder with other tools in your tech stack, prioritize platforms with strong integration capabilities like Jotform or Airtable.
4. Budget Constraints
Consider your budget carefully. Options range from free (Tally) to significant monthly investments for enterprise-grade solutions like Caspio or TrackVia.
Recommended Approach
Start by defining your specific requirements and use cases before evaluating platforms. Most offer free trials, so test 2-3 options that seem most aligned with your needs before making a final decision.
Frequently Asked Questions
References
- Best Low Code Development Platform Software with Data Visualization - GetApp
- No-Code Data Visualization: Making Data Accessible - Knack
- Power BI: Microsoft's Low-Code Data Visualization Solution - Cellenza
- Low Code Form Builder - DronaHQ
- Top Open Source Form Builders - Budibase
- Tally: Free Online Form Builder
- Jotform Website - Form Builder Platform
Recommended Searches
Last updated April 8, 2025