
Creating the Perfect Buffett Indicator Iframe: Your Window to Market Valuation Insights
Seamlessly embed Warren Buffett's favorite market valuation tool into your website with this comprehensive iframe implementation guide
Key Implementation Highlights
- Responsive Design: The iframe adapts to different screen sizes, ensuring optimal viewing on any device
- Clean Integration: Borderless implementation that blends seamlessly with your existing website design
- Performance Optimized: Configured for fast loading and smooth scrolling of the Buffett Indicator content
Your Ready-to-Use Iframe Code
Here's a responsive iframe code snippet that you can immediately copy and paste into your HTML document:
<iframe
  src="https://www.currentmarketvaluation.com/models/buffett-indicator.php"
  title="Buffett Indicator Valuation Model"
  width="100%"
  height="600px"
  style="border:none; max-width:1200px; margin:0 auto; display:block;"
  scrolling="yes"
></iframe>
Understanding the Iframe Parameters
| Parameter | Value | Purpose |
|---|---|---|
| src | URL to the Buffett Indicator page | Specifies the webpage to embed |
| title | "Buffett Indicator Valuation Model" | Improves accessibility for screen readers |
| width | 100% | Makes the iframe responsive to container width |
| height | 600px | Sets a fixed height for consistent display |
| style | CSS properties | Removes border, centers, and limits maximum width |
| scrolling | yes | Enables scrolling within the iframe |
Customization Options
Feel free to adjust these parameters based on your specific needs:
- Height: Increase or decrease the "600px" value for taller or shorter display
- Max-width: Modify "1200px" to better fit your layout
- Border: Add a border by changing "border:none" to "border:1px solid #ccc"
Understanding the Buffett Indicator
The Buffett Indicator, named after legendary investor Warren Buffett, is a valuation metric that compares the total value of all publicly traded stocks in a country to that country's Gross Domestic Product (GDP). Warren Buffett famously described this ratio as "probably the best single measure of where valuations stand at any given moment."
Current Valuation Insights
As of April 2025, the Buffett Indicator for the US market stands at approximately 211%, which is significantly above historical averages. This suggests that the stock market may be substantially overvalued relative to the underlying economy. The indicator is calculated by dividing the total US stock market capitalization (approximately $62.29 trillion) by the US GDP (about $29.55 trillion).
Interpretation Framework
The indicator serves as a long-term valuation gauge with several interpretation thresholds:
- Below 75%: Significantly undervalued market
- 75% to 90%: Moderately undervalued market
- 90% to 115%: Fairly valued market
- 115% to 150%: Moderately overvalued market
- Above 150%: Significantly overvalued market
This radar chart compares the Buffett Indicator with other popular market valuation metrics across various dimensions. The Buffett Indicator scores particularly high on simplicity and market recognition, making it widely accessible for investors of all experience levels.
Critical Components of the Buffett Indicator
The Buffett Indicator combines macroeconomic and financial market data to provide a comprehensive valuation perspective. Understanding its components helps investors better interpret its signals.
This mindmap outlines the key components and considerations of the Buffett Indicator. By understanding both the market capitalization and GDP elements, investors can better contextualize the ratio's signals and potential limitations.
Visual Insights: The Buffett Indicator Over Time
The historical perspective of the Buffett Indicator reveals important patterns about market cycles and valuation extremes. These visual representations offer valuable context for current readings.
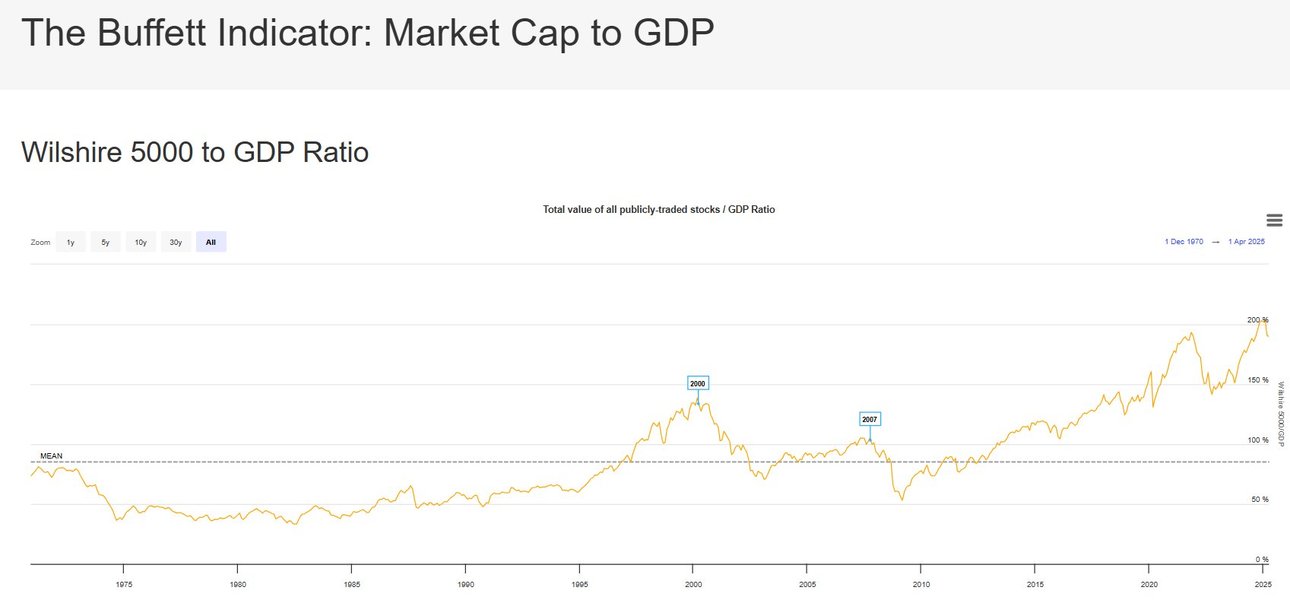
This chart illustrates the Buffett Indicator's historical trend line, with the current reading near all-time highs. Note how previous peaks often preceded significant market corrections, including the dot-com bubble of 2000 and the financial crisis of 2008. The current elevated level suggests investors should exercise caution in their market outlook.
Expert Video Analysis: Understanding the Buffett Indicator
For a deeper understanding of how to interpret and apply the Buffett Indicator to your investment decisions, this expert analysis provides valuable insights:
This comprehensive video explains Warren Buffett's famous market valuation tool, walking through its calculation methodology, historical significance, and practical applications for investors. The presenter breaks down complex concepts into accessible insights, making it valuable for both novice and experienced investors seeking to understand current market conditions.
Frequently Asked Questions
References
- Buffett Indicator - Current Market Valuation
- Koyfin - Independent Investors Research Platform
- The Little Book of Valuation - Current Market Valuation
- The Intelligent Investor - Benjamin Graham
- Investment Valuation - Textbook on Investment Tools
Recommended Searches
Last updated April 8, 2025