
Comprehensive Guide to Visualizing Candida as an Opportunistic Pathogen
Enhancing Your Medical Articles with High-Quality Candida Imagery
Key Takeaways
- Understanding Candida Pathogenicity: Visual representations are crucial for illustrating the opportunistic nature of Candida infections.
- Species Distribution and Resistance: Accurate images support the analysis of different Candida species and their antifungal resistance patterns.
- Clinical Impact: Photographs depicting the clinical burden of Candida infections enhance the comprehension of their significance in healthcare settings.
1. Candida as an Opportunistic Pathogen
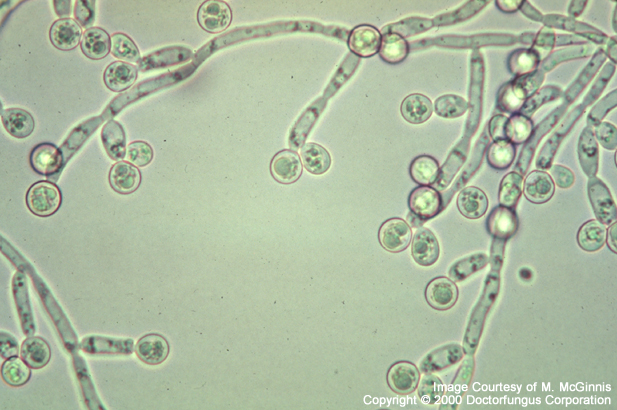
Candida species, particularly Candida albicans, are recognized as opportunistic pathogens that can cause a range of infections, especially in individuals with compromised immune systems. Visual representations of Candida are essential for understanding its morphology, growth patterns, and the mechanisms by which it becomes pathogenic.
1.1. Microscopic Images
Microscopic images of Candida albicans demonstrate its yeast and hyphal forms, which are critical for diagnosing infections. These images can be obtained from academic journals, microbiology databases, and specialized image repositories.
1.1.1. Microscopy Techniques
Different microscopy techniques such as light microscopy, electron microscopy, and fluorescence microscopy provide varying levels of detail. High-resolution images can reveal the structural changes in Candida cells that contribute to their pathogenicity.
1.2. Culture Plates and Colony Morphology
Photographs of Candida growing on culture media, such as Sabouraud agar, showcase colony morphology, which is vital for species identification. Visual distinctions between species like C. albicans, C. glabrata, and C. auris are important for accurate diagnosis and treatment.
1.2.1. Colony Characteristics
Candida colonies exhibit specific characteristics such as color, texture, and growth rate. Documenting these features through photography aids in differentiating between pathogenic and non-pathogenic strains.
2. Importance of Studying Species Distribution and Antifungal Resistance
Understanding the distribution of various Candida species and their resistance to antifungal agents is crucial for managing infections effectively. Visual tools like distribution maps, resistance charts, and comparative images play a significant role in conveying this information.
2.1. Species Distribution Maps
Maps illustrating the geographical distribution of Candida species provide insights into epidemiological trends. These visuals help in identifying regions with high prevalence rates and emerging resistant strains.
2.1.1. Geographic Trends
By mapping the occurrence of different Candida species globally, researchers and healthcare professionals can track the spread of resistant strains like C. auris, enabling targeted interventions.
2.2. Antifungal Resistance Charts
Charts depicting antifungal resistance patterns among Candida species aid in understanding the challenges in treatment. These visuals highlight the efficacy of various antifungal agents against different strains.
2.2.1. Resistance Mechanisms
Visual representations of resistance mechanisms, such as mutations in drug targets or the presence of efflux pumps, are essential for illustrating how Candida adapts to antifungal treatments.
3. Increasing Burden of Candida Infections in Clinical Settings
The rise in Candida infections within healthcare environments underscores the need for comprehensive visual documentation. Photographs depicting clinical scenarios, infection sites, and statistical data help in understanding the scope and impact of these infections.
3.1. Clinical Manifestations
Images showcasing the clinical manifestations of candidiasis, such as thrush in the oral cavity or skin rashes, are invaluable for medical education and patient awareness.
3.1.1. Visual Diagnosis
Photographs of patients exhibiting symptoms of Candida infections aid healthcare providers in making accurate diagnoses and differentiating from other similar conditions.
3.2. Epidemiological Data Visualization
Graphs and infographics illustrating the rise in Candida infection rates, affected populations, and mortality statistics are critical for highlighting the clinical burden and justifying the need for improved management strategies.
3.2.1. Statistical Representations
Effective use of bar charts, pie charts, and line graphs can convey complex epidemiological data in an easily understandable format, facilitating informed decision-making in healthcare settings.
4. Sources for High-Quality Candida Images
Obtaining high-quality images is essential for creating informative and visually appealing articles on Candida infections. Below are recommended sources and tips for acquiring relevant photographs and illustrations.
4.1. Stock Image Websites
Platforms like Shutterstock and Adobe Stock offer a vast collection of scientific images, including microscopic views of Candida, culture plates, and clinical manifestations. Ensure to check licensing agreements for usage rights.
4.1.1. Selecting Appropriate Images
When browsing stock image websites, use specific search terms like "Candida albicans microscopy," "Candida culture plate," or "candidiasis clinical images" to find relevant visuals.
4.2. Academic and Scientific Databases
Databases such as PubMed, ScienceDirect, and Wiley Online Library host a plethora of research articles that include high-resolution images and diagrams related to Candida species and their clinical impact.
4.2.1. Accessing Image Collections
Many academic articles provide supplementary materials with detailed images. Accessing these through institutional subscriptions can grant permission to use these visuals with proper citation.
4.3. Open Access Repositories
Websites like Wikimedia Commons, Flickr (Creative Commons), and Unsplash offer free-to-use images under various licenses. Verify the terms of use to ensure compliance with attribution requirements.
4.3.1. Creative Commons Licensing
When using images from open access repositories, pay attention to the specific Creative Commons license. Some images may allow for modification and commercial use, while others may have restrictions.
4.4. Professional Organizations and Health Agencies
Organizations like the Centers for Disease Control and Prevention (CDC) and the World Health Organization (WHO) provide access to detailed graphics, infographics, and photographs related to Candida infections.
4.4.1. Utilizing Official Resources
Official resources from health agencies often come with comprehensive data and high-quality visuals that can enhance the credibility of your article. Ensure to adhere to their usage guidelines.
5. Creating Custom Visuals
In addition to sourcing existing images, creating custom visuals tailored to your article's specific focus can provide unique insights and enhance reader engagement.
5.1. Combining Data into Infographics
Infographics that combine statistical data on Candida species distribution, antifungal resistance rates, and clinical outcomes can present complex information in an accessible and visually appealing manner.
5.1.1. Design Tools
Utilize graphic design software like Adobe Illustrator, Canva, or infographic-specific tools to craft custom visuals that align with your article's content and aesthetic.
5.2. Diagramming Pathogenic Mechanisms
Illustrations that depict the pathogenic mechanisms of Candida, such as biofilm formation and evasion of the immune system, can deepen the reader's understanding of its opportunistic nature.
5.2.1. Scientific Accuracy
Ensure that custom diagrams are scientifically accurate and sourced from reputable references to maintain the credibility of your article.
6. Best Practices for Image Usage
Adhering to best practices when using images in your article ensures ethical standards, legal compliance, and enhances the overall quality of your work.
6.1. Obtaining Permissions
Always verify the licensing terms of any image you intend to use. Obtain necessary permissions or licenses, especially for images sourced from academic journals or stock photo websites.
6.1.1. Attribution Requirements
Provide proper attribution for images that require it, following the specified format. This not only respects the creators' rights but also adds credibility to your article.
6.2. Image Quality and Resolution
Use high-resolution images (300 dpi or higher) to ensure clarity and professionalism in your article. Blurry or pixelated images can detract from the reader's experience and the article's perceived quality.
6.2.1. Standardizing Image Dimensions
Maintain consistency in image sizes and formats throughout your article to provide a cohesive and polished appearance.
6.3. Ethical Considerations
Respect patient privacy by avoiding identifiable information in clinical photographs. Use de-identified images or obtain consent when featuring patient-related visuals.
6.3.1. Sensitive Content Handling
Handle sensitive content with care to maintain professionalism and adhere to ethical guidelines in medical publications.
7. Sample Image Integration Table
The following table summarizes the types of images relevant to Candida as an opportunistic pathogen, their sources, and recommended usage scenarios.
| Image Type | Description | Recommended Sources | Usage Scenarios |
|---|---|---|---|
| Microscopic Images | Detailed views of Candida morphology and structures. | Academic journals, microscopy databases, Shutterstock. | Illustrating pathogenic mechanisms, educational content. |
| Culture Plate Photos | Visuals of Candida growth on various media. | Stock image websites, scientific research articles. | Demonstrating colony morphology, species identification. |
| Clinical Manifestations | Photographs of Candida infections in patients. | Medical image databases, WHO, CDC resources. | Highlighting infection symptoms, patient education. |
| Infographics and Data Charts | Visual representations of epidemiological data. | Graphic design tools, research publications. | Presenting species distribution, resistance patterns. |
Conclusion
Incorporating high-quality and relevant images into your article on Candida as an opportunistic pathogen enhances the reader's understanding and engagement. By utilizing various sources such as stock image websites, academic databases, and open access repositories, you can obtain the necessary visuals to effectively illustrate the pathogenic mechanisms, species distribution, antifungal resistance, and the increasing clinical burden of Candida infections. Additionally, creating custom infographics and adhering to best practices in image usage will ensure that your article is both informative and professionally presented.
References
Last updated February 13, 2025