
Unveiling the Odds: How Likely Is a Modern-Day Carrington Event to Disrupt Our World?
Exploring the probabilities of a powerful solar storm impacting Earth within the next decade or a human lifetime.
The prospect of a solar storm as powerful as the historic 1859 Carrington Event striking Earth raises significant concerns in our technologically reliant society. Understanding the likelihood of such an event is crucial for preparedness and mitigation. Scientific estimates, while varying, provide a framework for assessing this risk.
Key Insights: Carrington Event Probabilities
- Decadal Risk is Low but Real: Estimates for a Carrington-level event occurring in the next 10 years generally range from approximately 0.5% to 12%, depending on the statistical models and historical data used.
- Lifetime Risk Accumulates: Over an average human lifespan (around 70-80 years), the cumulative probability increases, with some estimates suggesting a chance of 10% or higher, and potentially significantly more under certain models.
- Modern Vulnerability is High: Unlike in 1859, today's global infrastructure—power grids, satellites, communication networks, and the internet—is profoundly susceptible to the geomagnetic disturbances caused by such an event.
Understanding the Carrington Event
The Carrington Event of September 1-2, 1859, stands as the most intense geomagnetic storm in recorded history. It was triggered by a massive solar flare and an accompanying coronal mass ejection (CME) from the Sun. This solar outburst hurled a torrent of charged particles towards Earth, striking our planet's magnetosphere.
The immediate effects were dramatic: telegraph systems worldwide experienced failures, with some operators receiving electric shocks and pylons throwing sparks. Auroras, typically confined to polar regions, were seen as far south as the Caribbean, Cuba, and Hawaii, and as far north in the southern hemisphere as central Chile. If an event of similar magnitude were to occur today, the consequences for our technologically advanced civilization would be far more severe and widespread.
A historical overview of the 1859 Carrington Event and its observed impacts, providing context for understanding the potential of future solar superstorms.
Probability Estimates: Decade vs. Lifetime
Scientists employ various methods to estimate the likelihood of another Carrington-class solar storm. These include analyzing historical records of solar activity, tree ring data (which can reveal ancient, even stronger storms known as Miyake Events), and statistical modeling based on observed solar flare and CME frequencies and intensities.
Likelihood in the Next Decade
Estimates for a Carrington-level event in the next 10 years show some variation, reflecting the complexities of space weather prediction and the different assumptions made by researchers:
- Some earlier studies, like one by Pete Riley in 2012, suggested a probability as high as 12% for a Carrington-scale storm within a decade. This was based on power-law distributions of solar event magnitudes.
- Other analyses, such as J.J. Love's 2013 study using Poisson statistical modeling, calculated a probability of around 6.3%.
- More recent research, including a 2019 study in Scientific Reports using a Weibull distribution model, proposed a lower range, estimating the probability to be between 0.46% and 1.88% (with a 95% confidence interval) within the next decade. This model suggests that the probability may decrease the longer the period since the last major event.
- Other assessments place the annual chance at around 0.7%, which translates to a decadal probability of roughly 1-2%, though some researchers cite ranges up to 1.9% or even between 1.6% and 12% when considering broader definitions of catastrophic solar storms.
The current solar cycle, Solar Cycle 25, is expected to peak around 2024-2025 and is showing increased activity. While a solar maximum increases the general frequency of solar flares and CMEs, it doesn't automatically guarantee a Carrington-level event, which remains statistically rare.
Likelihood Over a Human Lifetime
When extending the timeframe to an average human lifespan (typically 70-80 years), the cumulative probability of experiencing such an event naturally increases:
- Estimates for a Carrington-level storm occurring within a century often hover around 10% to 12%. This figure provides a baseline for understanding the risk over a multi-decadal period, aligning with the idea of a roughly 1% chance per decade under some models.
- If higher decadal probabilities (like the 12% figure) are considered, the compounded risk over 70-80 years could be significantly higher, potentially reaching 50% or more according to some extrapolations based on exponential risk models. However, models suggesting lower decadal probabilities (like the 0.46%-1.88% range) would yield a lifetime risk closer to the 10-30% range.
- The historical record, including evidence of "Miyake Events" (superflares potentially much stronger than the Carrington Event, identified through cosmogenic isotopes in tree rings and ice cores) occurring every few thousand years, indicates that extreme solar events are a natural, albeit infrequent, part of Earth's space environment.
The variance in these estimates highlights the ongoing scientific effort to refine our understanding of extreme space weather probabilities.
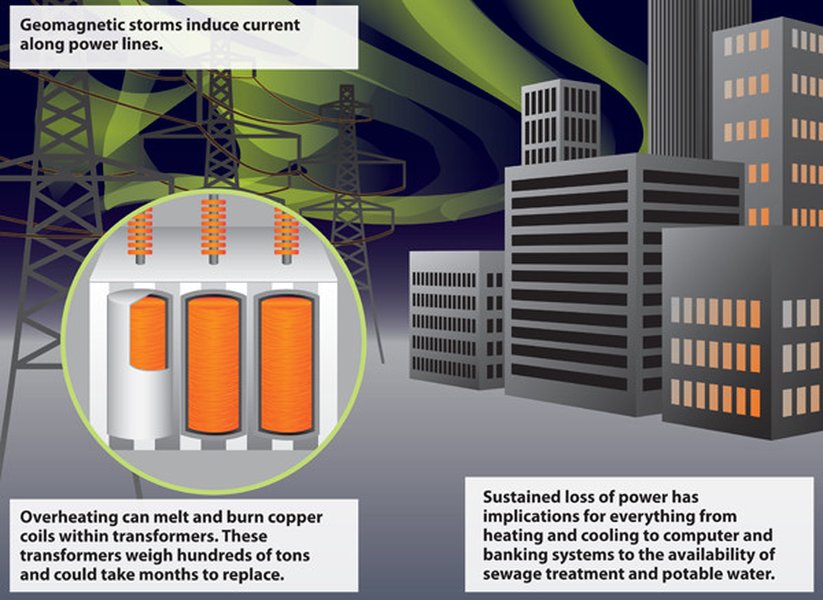
Illustration of potential damage to critical infrastructure, like this electrical transformer, which could result from a severe geomagnetic storm.
Comparative Probability Assessment
The following table summarizes the range of probability estimates for a Carrington-level solar storm across different timeframes, based on various scientific studies and models. It's important to note that these are statistical probabilities and the actual occurrence of such an event is unpredictable in the short term.
| Timeframe | Probability Range | Key Studies/Models Cited |
|---|---|---|
| Per Year | ~0.7% (some estimates) | General analysis of long-term patterns |
| Next Decade (10 years) | 0.46% - 12% | Riley (2012), Love (2013), Scientific Reports (2019), various national and international agency assessments |
| Next Century (100 years) | ~10% - 12% (some estimates) | Extrapolations from decadal studies, long-term historical analysis |
| Human Lifetime (~70-80 years) | Ranges from ~10% to potentially >50% | Cumulative risk based on decadal probabilities; varies significantly with the chosen model |
These figures underscore that while not an immediate certainty, a Carrington-level event is a plausible threat within generational timescales.
Factors Influencing Likelihood Assessments
The probability of a Carrington-level event is not a fixed number but rather an estimate derived from complex analyses. Several factors influence these assessments, leading to the observed range in predictions. The radar chart below visualizes conceptual differences in how optimistic (lower probability) versus pessimistic (higher probability) scenarios might weigh these factors.
For instance, a pessimistic view might give more weight to ancient, more powerful events (Miyake Events) and assume current solar cycle predictions lean towards higher activity, whereas an optimistic view might rely more on the observed frequency in the more recent, well-documented historical period and models that show decreasing probability over time if no event occurs.
Conceptual Overview of Solar Storm Risk
The mindmap below provides a simplified overview of the key aspects related to Carrington Event likelihood, from its definition and historical context to the factors influencing probability estimates and potential modern impacts.
Understanding these interconnected elements is vital for appreciating the multifaceted nature of the risk posed by extreme solar events.
Frequently Asked Questions (FAQ)
What exactly was the Carrington Event?
Why do probability estimates for another Carrington Event vary so much?
What would happen if a Carrington-level event occurred today?
Is the current solar cycle (Solar Cycle 25) making a Carrington Event more likely?
How does the May 2024 solar storm compare to a Carrington Event?
Recommended Further Exploration
- What are the potential economic impacts of a modern Carrington Event?
- How can we protect critical infrastructure from extreme solar storms?
- What were the Miyake Events and how do they compare to the Carrington Event?
- What is NOAA's Space Weather Prediction Center doing to forecast solar storms?
References
Last updated May 18, 2025