
Mastering Spreadsheet Data Categorization with Varied Text Strings
Unlock Efficiency: Strategies for Grouping and Organizing Data Despite Inconsistent Spellings
Key Insights into Categorizing Data with Inconsistent Text
- Leverage Formulaic Approaches: Advanced formulas like
XLOOKUPwithSEARCH(Excel) or combinations ofARRAYFORMULA,VLOOKUP, andSEARCH(Google Sheets) are powerful for identifying keywords within text strings and assigning categories dynamically. - Embrace Data Cleaning and Standardization: Before or during categorization, address inconsistent spellings and variations using techniques like "Remove Duplicates," "Text to Columns," or even fuzzy matching tools in Power Query, which can significantly improve accuracy.
- Utilize Grouping and Pivot Tables for Visualization: Once categorized, features like grouping rows and columns or creating Pivot Tables allow for quick summarization, analysis, and visualization of data, making trends and insights readily apparent.
Categorizing rows in a spreadsheet based on items within text strings, especially when those items have different spellings, is a common challenge in data management. This task often arises when dealing with raw, unstructured data from various sources, such as expense reports, customer feedback, or product descriptions. The goal is to bring order to chaos, transforming disparate entries into a coherent, analyzable dataset. This guide explores comprehensive strategies for both Excel and Google Sheets, offering practical formulas, built-in features, and advanced techniques to tackle this problem effectively.
Understanding the Core Challenge: Inconsistent Text Data
The Nature of Varied Spellings and Its Impact
Inconsistent spellings or variations of the same item within a text string can significantly hinder data analysis. For instance, "Uber Pool" and "UberPool" might refer to the same service, but a simple exact match lookup would treat them as distinct. Similarly, company names like "McDonalds," "McDonald's," and "Mcdonald's" need to be recognized as a single entity. This inconsistency prevents accurate aggregation, filtering, and reporting, making it difficult to gain meaningful insights from your data.
The core problem lies in the inability of standard lookup functions (like exact match VLOOKUP or MATCH) to handle partial text matches or variations. To overcome this, you need methods that can "fuzzy match" or intelligently identify keywords within longer strings, regardless of minor discrepancies or additional surrounding text.
Strategies for Categorizing in Excel
Formula-Based Categorization with Keywords
Excel offers powerful formula combinations to categorize text based on keywords embedded within a string. The key is often to use functions that can search for a substring within a larger text and then combine this with a lookup mechanism to assign a category.
Implementing XLOOKUP and SEARCH for Keyword Matching
For modern Excel versions, the XLOOKUP function combined with ISNUMBER and SEARCH provides a robust solution. This approach allows you to check if any of a predefined list of keywords exists within a text string and return a corresponding category.
Consider a scenario where you have expense descriptions in Column B and a list of keywords in Column E with their corresponding categories in Column F. The formula in cell C5 might look like this:
=XLOOKUP(TRUE,ISNUMBER(SEARCH(keyword,B5)),category)
Here:
keyword(e.g.,E5:E13) is a named range containing your lookup keywords (e.g., "Vegetables", "AT&T", "Wine").category(e.g.,F5:F13) is a named range containing the categories associated with those keywords (e.g., "Meals", "Multimedia").SEARCH(keyword,B5)attempts to find each keyword from your list within the text in cell B5. If found, it returns the starting position; otherwise, it returns an error.ISNUMBER()converts these results into TRUE (if a number, meaning keyword found) or FALSE (if an error). This creates an array of TRUE/FALSE values.XLOOKUP(TRUE, ..., category)then looks for the first TRUE in this array and returns the corresponding category from thecategorynamed range.
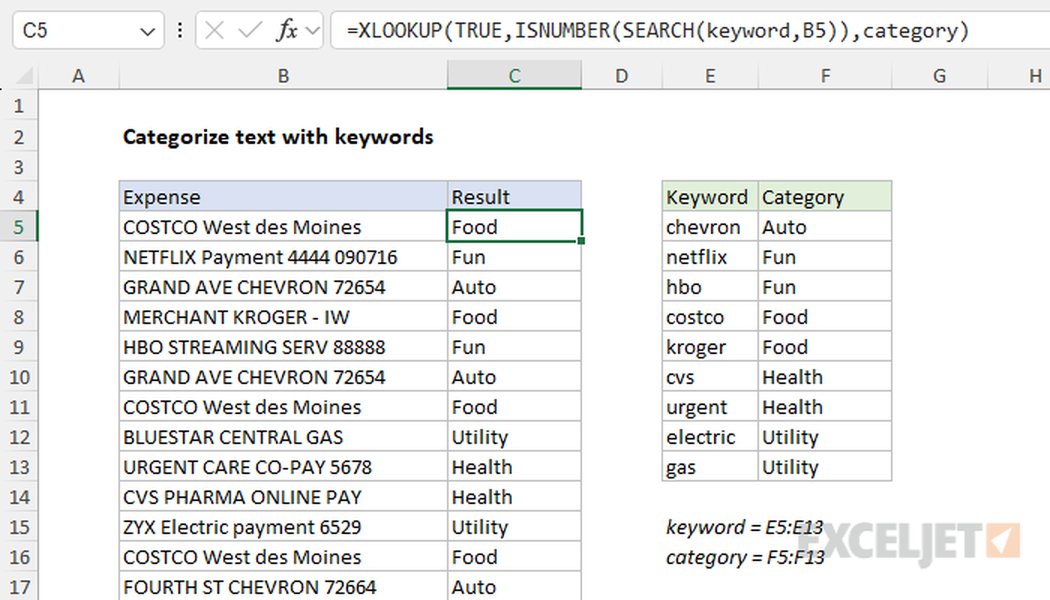
An example of using XLOOKUP and SEARCH to categorize text based on keywords in Excel.
This method is highly effective for categorizing based on partial text matches, as SEARCH is not case-sensitive by default and looks for substrings.
Using IF, SEARCH, and ISNUMBER for Multiple Conditions
For older Excel versions or scenarios with fewer categories, nested IF statements combined with SEARCH and ISNUMBER can also work:
=IF(ISNUMBER(SEARCH("keyword1", A2)), "Category1",
 IF(ISNUMBER(SEARCH("keyword2", A2)), "Category2",
 "Other"))
This formula checks for "keyword1" first, if found assigns "Category1", otherwise moves to check for "keyword2", and so on. This can become cumbersome with many categories.
Data Cleaning and Standardization Techniques
Before applying categorization logic, it's often beneficial to clean and standardize your data. This can resolve common issues like spelling errors or different formatting of the same item.
Text to Columns Feature
If your inconsistent data can be broken down by a specific delimiter (e.g., "Software-Adobe Acrobat 1" where "-" is a delimiter), the "Text to Columns" feature under the Data tab can help separate relevant parts of the text. This might make the "item" easier to isolate for categorization.
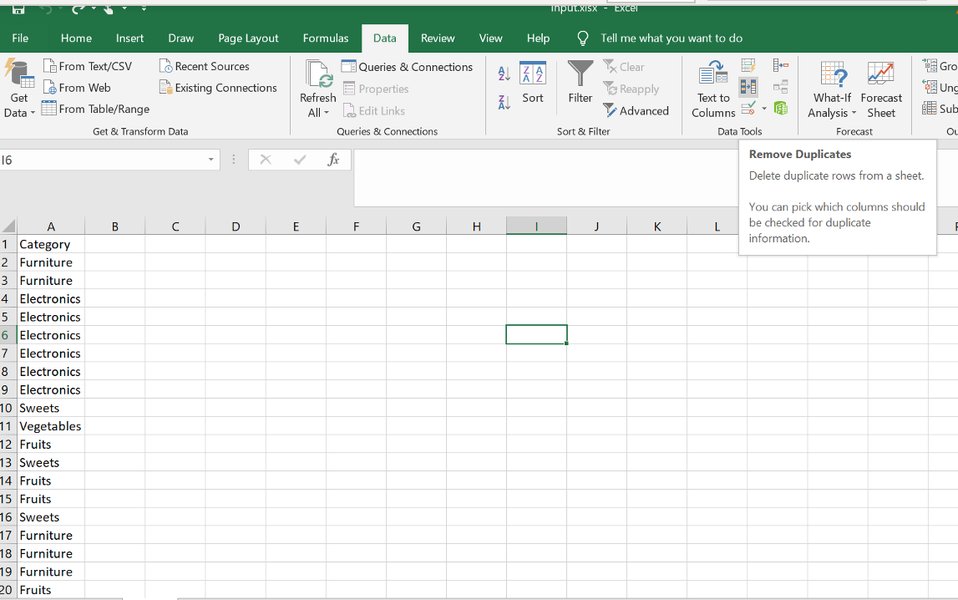
Remove Duplicates for Standardization
While not directly categorizing, "Remove Duplicates" can be used as part of a standardization process. You can copy the column with inconsistent names to a new sheet, remove duplicates, manually correct the spellings, and then use this cleaned list as a lookup table for your main data using VLOOKUP or XLOOKUP with approximate matching or even fuzzy lookups if available via Power Query.
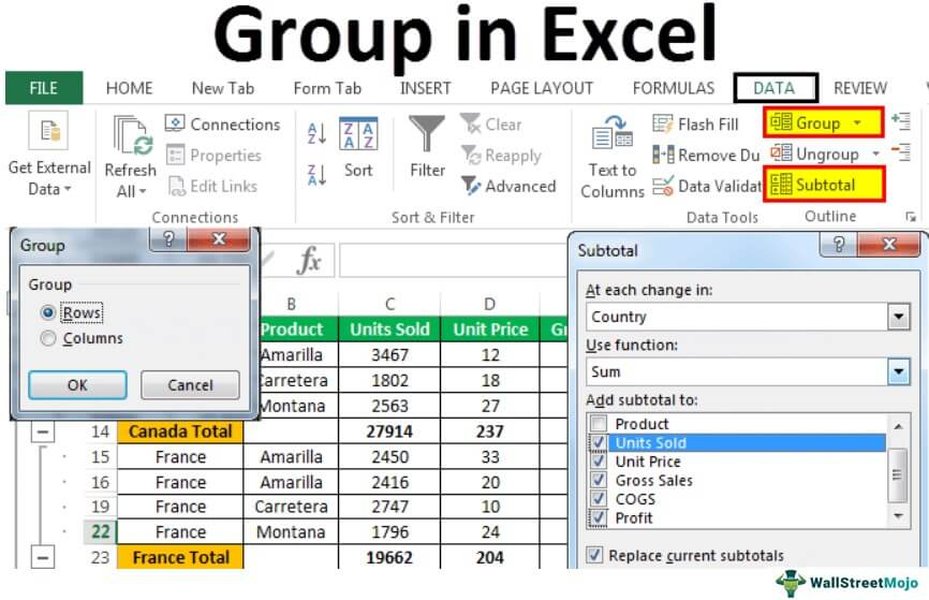
Visual representation of how data can be grouped and organized in Excel.
Advanced Grouping and Summarization
Once categories are assigned, Excel's grouping and outlining features, along with PivotTables, are invaluable for analysis.
Grouping Rows and Columns
Excel allows you to group rows or columns, enabling you to collapse and expand sections of your data. This is particularly useful for presenting data by category, allowing users to view summary information or drill down into details. To group, select the rows you want to group, go to the Data tab, and click Group.
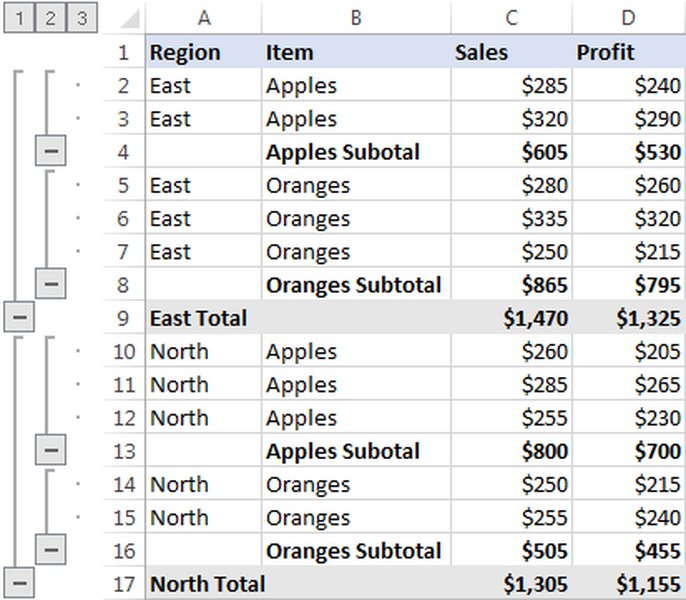
An example of nested grouping, providing a hierarchical view of data.
You can create multiple levels of groups for a more granular organization. This feature is excellent for quickly displaying summary rows or columns and revealing detail data for each group.
Utilizing PivotTables for Dynamic Categorization and Analysis
PivotTables are one of the most powerful tools for categorizing and summarizing large datasets, even with varying text entries once a consistent categorization method is in place. You can drag your newly created "Category" column into the "Rows" or "Columns" area of the PivotTable fields, and then summarize other numerical data (like "Amount") by these categories. PivotTables can also handle implicit grouping of similar items, especially after initial data cleaning.
Categorization in Google Sheets
Formulaic Approaches in Google Sheets
Google Sheets offers similar, and sometimes even more flexible, array-based formulas for text categorization.
Using ARRAYFORMULA with VLOOKUP and SEARCH (or REGEXMATCH)
For categorizing data based on partial text matches from a keyword list, a combination of ARRAYFORMULA, VLOOKUP, and SEARCH (or REGEXMATCH for more complex patterns) is highly effective. You would typically create a separate "Categories" sheet or range with your keywords and their corresponding categories.
Suppose your data is in Column B of "Sheet1" and your keywords and categories are in "Categories!A:B". A formula in "Sheet1"!C2 could be:
=ARRAYFORMULA(IF(B2:B="",,VLOOKUP(TRUE,ARRAYFORMULA(ISNUMBER(SEARCH(Categories!A:A,B2:B))),Categories!B:B,FALSE)))
This formula:
SEARCH(Categories!A:A,B2:B)searches for each keyword fromCategories!A:Awithin each text string inB2:B.ISNUMBER()converts the results to TRUE/FALSE.VLOOKUP(TRUE, ..., FALSE)performs an approximate match to find the first TRUE and returns the corresponding category.ARRAYFORMULAapplies this logic across the entire column automatically.- The initial
IF(B2:B="",,)handles blank cells to prevent errors.
Leveraging the QUERY Function for Dynamic Filtering
Once categorized, the QUERY function in Google Sheets is invaluable for dynamically extracting and organizing data based on categories. For example, to pull all rows belonging to the "Groceries" category from a column named "Category":
=QUERY(A:C, "SELECT A, B, C WHERE C = 'Groceries'")
This creates a dynamic view of your data, making it easy to analyze specific categories without altering the original dataset.
Built-in Features and Best Practices in Google Sheets
Sorting and Filtering Data
Google Sheets provides built-in sorting and filtering capabilities. You can sort a sheet by a specific column (e.g., your newly assigned "Category" column) to group similar entries together. Filters allow you to display only rows that meet certain criteria, such as containing a specific category. This is fundamental for initial exploration and quick categorization checks.
An overview of Google Sheets' interface, highlighting features for data organization.
Conditional Formatting for Visual Categorization
Conditional formatting can visually enhance your categorization. You can set rules to automatically apply specific formatting (e.g., background color, font color) to cells based on their assigned category. This provides an immediate visual cue for different categories, making it easier to spot trends or outliers.
For instance, if tracking expenses, you could highlight transactions over a certain amount in red, or color-code each category differently for quick identification.
Grouping Rows for Readability
Similar to Excel, Google Sheets allows you to group rows. This feature helps in organizing large datasets by collapsing and expanding sections based on shared categories. This is particularly useful for project management or detailed reports, where you might want to hide detailed entries and show only summary rows.
A video demonstrating how to group rows and columns in Excel for better data organization.
Addressing Inconsistent Spellings: A Deeper Dive
The Power of Fuzzy Matching and AI Tools
When dealing with truly messy data, where simple partial matches aren't enough due to significant spelling variations or abbreviations, more advanced techniques come into play.
Manual Cleaning and Lookup Tables
For smaller datasets or initial cleaning, a manual approach combined with a lookup table can be very effective. Create a new column, copy the original text strings, remove duplicates, and then manually standardize each unique string. Once you have a clean "standardized" list, you can use VLOOKUP or XLOOKUP with an exact match against this table to replace inconsistent spellings in your original data.
A visual guide demonstrating the process of creating and utilizing a category list in Excel.
Using Power Query's Fuzzy Grouping (Excel)
Excel's Power Query (available in Excel 2016 and later) offers a "Fuzzy Merge" or "Fuzzy Grouping" feature which is specifically designed to handle inconsistent spellings. This feature uses algorithms to match similar text strings, even if they're not identical. You can set a similarity threshold to control how loose or strict the matching should be. This is incredibly powerful for standardizing entries like company names ("Google Inc.", "Google", "Google Corp.") into a single, consistent value.
While this requires a bit more setup than a formula, it's often the most robust solution for large and messy datasets.
AI-Powered Tools and Add-ons
For even greater automation, AI-powered tools and add-ons are emerging for both Excel and Google Sheets. Services like Numerous.ai or similar AI spreadsheet analysis tools can leverage machine learning to analyze text descriptions and assign categories based on patterns, even with significant variations. These tools can "learn" from examples and categorize data with remarkable accuracy, saving immense manual effort.
Comparative Analysis of Categorization Methods
To help you choose the best method for your specific needs, here's a comparative radar chart evaluating different categorization approaches based on criteria like ease of use, scalability, accuracy, and handling of inconsistencies.
This radar chart illustrates the strengths and weaknesses of different categorization methods. Basic formulas are easy to implement for simple cases but struggle with scalability and inconsistencies. Advanced formulas offer better scalability and inconsistency handling. Power Query's fuzzy matching excels at automating the standardization of messy text but has a steeper learning curve. AI-powered tools offer the highest automation and best handling of inconsistencies for large datasets, often with a simpler user experience for the end-user once set up.
Summary of Key Techniques
Below is a concise table summarizing the most effective techniques for categorizing data with inconsistent text in spreadsheets, highlighting their primary use cases and benefits.
| Technique | Primary Tool(s) | Best For | Advantages | Considerations |
|---|---|---|---|---|
| Keyword-based Formulas | Excel (XLOOKUP, SEARCH, ISNUMBER), Google Sheets (ARRAYFORMULA, VLOOKUP, SEARCH/REGEXMATCH) | Categorizing based on known keywords within text strings. | Automated, flexible for partial matches, no manual sorting. | Requires a comprehensive keyword list; formula can be complex. |
| Data Grouping/Outlining | Excel (Data > Group), Google Sheets (Data > Group rows) | Visual organization and collapsing/expanding data for review. | Improves readability, allows for hierarchical views. | Doesn't categorize data itself; relies on existing categories. |
| Pivot Tables | Excel, Google Sheets | Summarizing and analyzing categorized data. | Dynamic reporting, easy aggregation, can handle large datasets. | Requires data to be pre-categorized or grouped. |
| Fuzzy Matching (Power Query) | Excel | Standardizing highly inconsistent text strings (e.g., company names with misspellings). | High accuracy for standardization, robust for very messy data. | Steeper learning curve, requires Power Query knowledge. |
| AI-Powered Add-ons | Excel, Google Sheets | Automating complex text categorization and analysis. | Highly accurate, scalable, often user-friendly interface. | May involve subscription costs, reliance on third-party services. |
Frequently Asked Questions (FAQ)
IF statements with SEARCH in Excel or Google Sheets is often the easiest starting point. For example, =IF(ISNUMBER(SEARCH("apple", A1)), "Fruit", IF(ISNUMBER(SEARCH("banana", A1)), "Fruit", "Other")).XLOOKUP with SEARCH (Excel) or a combination of ARRAYFORMULA, VLOOKUP, and SEARCH (Google Sheets) that iterates through your keyword list. This allows multiple keywords to map to the same category.SEARCH (in both Excel and Google Sheets) are designed for this purpose. They will return a numeric position if the keyword is found anywhere within the text string, allowing you to categorize based on partial matches.ARRAYFORMULA in Google Sheets), new data added to the primary column will automatically be categorized. For more advanced automation, consider using Power Query in Excel or Google Apps Script for custom solutions.Conclusion
Categorizing rows in a spreadsheet based on items within text strings, especially with inconsistent spellings, is a fundamental step towards effective data analysis. While challenging, both Excel and Google Sheets offer a range of powerful tools and techniques to address this. From versatile formulas like XLOOKUP and ARRAYFORMULA that leverage partial text matching, to robust data cleaning features like Power Query's fuzzy grouping, and the visual summarization capabilities of Pivot Tables and row grouping, a solution exists for almost every level of data complexity and user expertise. By understanding and applying these methods, you can transform messy, unstructured text data into well-organized, insightful information, unlocking its full analytical potential.
Recommended Further Queries
- How to clean inconsistent data in Excel using Power Query?
- Advanced VLOOKUP techniques for partial matches in Google Sheets.
- Using REGEXMATCH for complex text pattern categorization in Google Sheets.
- Integrating AI for spreadsheet data categorization.