
Understanding the Parts of Chapter 4 in a Correlational Research Study
A detailed exploration of the structure and components for presenting correlational findings
Key Takeaways
- Clear Organization: Chapter 4 is structured to present data, analysis, and interpretation in a logical and systematic manner.
- Data Presentation: Emphasis is placed on visually and statistically communicating the relationships between variables.
- Interpretation and Discussion: The chapter bridges the gap between raw findings and their implications, addressing both strengths and limitations.
Introduction to Chapter 4 in Correlational Research
In correlational research, Chapter 4 serves as the central component of a thesis or dissertation where you present, analyze, and interpret the data gathered from your study. Unlike experimental research, which often emphasizes cause-and-effect relationships, correlational studies are designed to identify and describe the statistical relationships between variables. This chapter is essential because it explains how the data support, refute, or nuance the hypotheses or research questions that guided the study.
Detailed Structure of the Chapter
4.1 Introduction to the Chapter
The chapter typically starts with a brief introduction that reiterates the purpose of the study and outlines the research questions or hypotheses. This section sets the stage by reminding the reader of the context and importance of the investigation, and it serves as a roadmap for the chapter. The introduction part should include:
Purpose and Scope
This section briefly recapitulates the research problem and its significance. It outlines the central research questions or issues being addressed and explains the rationale for using correlational analysis. The introduction also briefly mentions the statistical techniques that will be used, such as Pearson's correlation, Spearman's rho, or other appropriate measures, signaling to the reader what to expect in the following sections.
4.2 Data Preparation and Cleaning
Before delving into the analyses, it is important to explain how the raw data were processed. This part discusses data cleaning procedures, the treatment of missing values, outlier detection, and the methods used to ensure that the dataset is appropriate for analysis. This section demonstrates the rigor of your methodology and ensures that the findings are based on reliable data.
Data Quality Assurance
Include details on how data quality was maintained. This might involve screening techniques, imputation methods for missing data, and how any outliers were handled. Such a discussion builds trust in the results presented later.
4.3 Presentation of Data
The presentation of data is crucial to effectively communicate the core findings of the correlational research. This section is usually divided into two main parts: descriptive statistics and the presentation of the core correlational findings.
Descriptive Statistics
Begin with a comprehensive summary of the data demographics and main characteristics. Present measures such as means, medians, standard deviations, and ranges for each variable included in your study. This provides the reader with a snapshot of the sample and the distribution of key variables.
Visual Data Representation
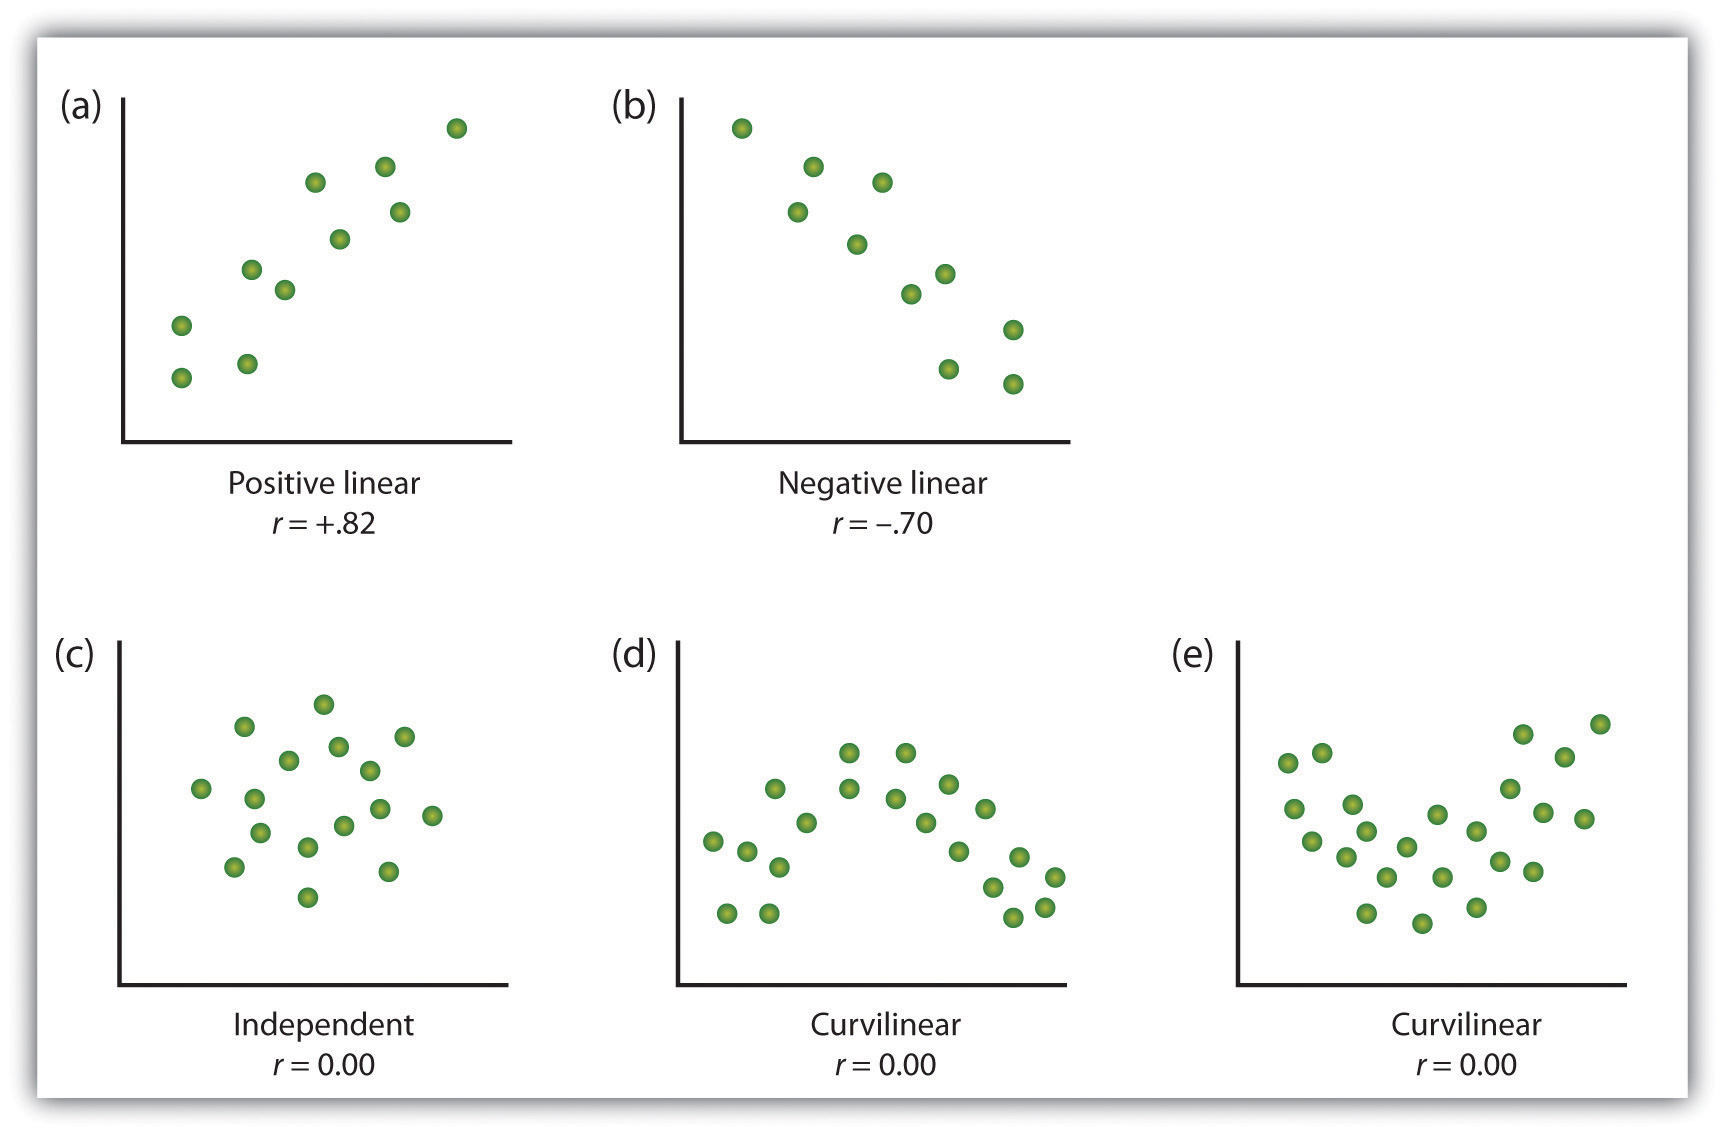
Graphical displays, such as scatter plots, bar charts, histograms, or correlation matrices, can significantly enhance the interpretability of the presented data. In a correlational study, scatter diagrams are particularly useful since they visually represent the relationship between paired variables. Tables and figures serve as essential tools for summarizing the results.
Example Data Table
| Variable 1 | Variable 2 | Correlation Coefficient | Significance (p-value) |
|---|---|---|---|
| Measure A | Measure B | 0.65 | 0.01 |
| Measure A | Measure C | -0.45 | 0.03 |
| Measure B | Measure C | 0.25 | 0.10 |
The table above is an example of how correlation coefficients might be presented in Chapter 4. In your report, ensure each table or figure is numbered and titled according to the guidelines provided by your institution.
4.4 Data Analysis Techniques
This key section delves into the methods used to analyze the relationships between variables. It is here that you detail the statistical procedures and techniques employed to explore the data. Central to correlational research are various statistical tests and measures that capture the strength and direction of relationships.
Overview of Statistical Techniques
The analytical procedures are described clearly with explanations of why certain methods are chosen:
- Pearson’s Correlation: It measures the linear relationship between two continuous variables, providing a coefficient between -1 and 1 that indicates both the strength and direction of the association.
- Spearman’s Rho: This non-parametric measure is used when the data do not meet the assumptions required for Pearson’s correlation, such as normality.
- Other Measures: Depending on the nature of the variables, other measures like point-biserial correlation (for one dichotomous and one continuous variable), Gamma, or chi-square tests might be employed. Each of these measures is chosen based on the level of measurement and the nature of the data.
Interpretative Techniques
It is not enough to simply report the statistics; you must also interpret what these numbers mean in the context of your study. This includes discussing:
- Correlation Strength: Interpretation should distinguish between weak, moderate, and strong correlations, explaining the practical meaning of these classifications.
- Correlation Direction: Indicate whether correlations are positive or negative, and discuss what these directions imply for the relationship between variables.
- Statistical Significance: Include p-values and confidence intervals to support your interpretations. Explain whether the observed correlations are statistically significant and what this means for the validity of your research questions.
4.5 Results and Findings
After presenting the methodological and analytical details, the next crucial part of Chapter 4 is the presentation of the findings derived from the analysis. This section emphasizes:
Reporting Key Statistics
In this section, all key numerical results are detailed. These include:
- Correlation coefficients between variables
- Associated significance levels (p-values) to confirm hypotheses or answer research questions
- Supplementary analyses (if applicable), such as partial correlations or regression statistics when controlling for potential confounders. These enhance the depth of interpretation by considering third-variable issues or other methodological concerns.
Use of Tables and Figures
Visual aids like tables and charts make it easier for readers to grasp the results at a glance. A detailed explanation should accompany each table or figure. For instance, if a scatter plot shows the relationship between two variables, the accompanying text should explain what the plot reveals about the strength, direction, and significance of the correlation.
4.6 Interpretation of Findings
Beyond mere presentation, Chapter 4 is critical in interpreting the results. Here, you discuss the meaning behind the numbers.
Linking Back to Research Questions
Each significant correlation must be discussed in the framework of the research questions or hypotheses. Describe how the findings align or diverge from your expected outcomes and the existing literature discussed in earlier chapters. This contextual analysis is central to understanding the implications of your work.
Comparisons and Contrasts
Draw comparisons where applicable; for example, if one variable shows a strong correlation with another but a weak correlation with a different variable, explain the possible reasons. This might include theoretical insights, differences in measurement scales, or external factors influencing this variability.
Addressing Limitations
It is essential to acknowledge any limitations that might affect the interpretation of the results. Common limitations in correlational research include the inability to infer causality, potential confounding variables, and issues related to sample size or selection bias. Recognizing these limitations not only demonstrates scholarly rigor but also helps to pave the way for future research.
4.7 Methodological and Analytical Considerations
A dedicated section for methodological considerations in Chapter 4 is often used to discuss broader factors influencing the analysis:
Third Variable and Directionality Issues
In correlational studies, one critical aspect is to consider how other variables might be influencing the relationship between the two primary variables. Explain any analytical steps taken to control for these third variable issues or discuss the implications if such controls were not applied.
Addressing Potential Biases
Discuss any inherent biases in the data collection or analytical methods. Include discussions of potential selection bias, confounding factors, and other issues that might limit the generalizability of your findings. This transparency is valuable in demonstrating the reliability of your research.
4.8 Summary and Transition
The final section of Chapter 4 is a concise summary of the main findings and a smooth transition to the next chapter where these results will be discussed in greater detail, typically in a broader context with implications, conclusions, and recommendations.
Recapitulation of Key Findings
Provide a brief summary that highlights the most significant results. This recapitulation should include the major correlations found, their statistical significance, and any noteworthy patterns. This serves as a quick reference point for readers as they move to the subsequent chapters.
Transition to Discussion
A well-crafted transition helps the reader to anticipate a more in-depth discussion of the implications of these findings in the following chapter. You might briefly mention that further analysis and theoretical interpretation will be covered in the next part of your study.
Integrative Overview: Chapter 4 as a Whole
Taken as a whole, Chapter 4 in correlational research is a comprehensive document that provides the empirical backbone to your thesis or dissertation. The chapter not only presents data statistically but also convincingly relates these numbers back to your research questions. It is a blend of robust statistical reporting and thoughtful interpretation—designed to validate the research approach while laying a foundation for theoretical discussion in subsequent chapters.
Additional Considerations in Crafting a Robust Chapter 4
While the structure provided above is widely accepted and recommended, adaptations might be needed based on specific institutional guidelines, the nature of your data, or the particularities of your research focus. Regardless of variations, clarity, precision, and comprehensive coverage of the following areas remain essential:
Transparency in Presentation
Every numerical representation, graphic, and table should be accompanied by clear captions and explanations. This practice not only reinforces the validity of the findings but also ensures that your audience – which might include readers who are not experts in statistical analysis – can follow your arguments.
Consistency with Other Chapters
Chapter 4 should neatly align with previous chapters, especially the literature review and methodology sections. Any data analysis strategies introduced in Chapter 3 should be revisited with practical results here. This consistency is critical for creating a cohesive narrative throughout your study.
Integrating Theory and Empirical Evidence
Even though Chapter 4 is focused on empirical findings, integrating theory to inform your interpretation enhances the overall rigor of the discussion. As you explain the correlations in your data, draw parallels with theories and concepts reviewed previously. This linkage reinforces the importance of your empirical work in contributing to or challenging existing knowledge.
Practical Tips for Writing Chapter 4 Effectively
In addition to knowing the components, the effective presentation of Chapter 4 can be enhanced by practical writing strategies:
Organized Structure and Clear Headings
Maintain a logical flow with appropriate subheadings, as this makes the chapter more navigable. A well-organized layout not only helps the reader follow the analysis but also aids you in ensuring that all important aspects are covered.
Attention to Detail and Accuracy
Double-check that all statistical measures are correctly calculated and clearly reported. Attentiveness to detail demonstrates the rigor of your methodology and enhances the credibility of your findings. Each figure and data point should be accurately referenced and explained.
Use of Visual Aids
Visual summaries such as diagrams, scatter plots, and tables can transform a dense presentation of numbers into an intuitive and understandable format. Ensure that these visual aids are high quality, clearly labeled, and directly connected to the analysis narrative.
Conclusion
Chapter 4 in correlational research is a critical section that bridges raw data and meaningful insights. It encompasses an introduction that re-establishes the study's purpose, a detailed presentation of cleaned and organized data, rigorous statistical analysis complete with graphical and tabular representations, and a thoughtful interpretation of the findings in relation to the hypothesis and existing literature. Key aspects such as transparency in data preparation, clarity in the presentation of results, and an insightful discussion on the implications and limitations collectively ensure that this chapter meets scholarly standards. Adhering to a clear and well-organized structure not only helps in delivering your findings effectively but also adds credibility to your research study.
By addressing the essential components described above and carefully integrating rigorous analysis with clear interpretation, your Chapter 4 will robustly support the overall narrative of your correlational research study. This comprehensive approach is crucial in ensuring that your study contributes valuable insights while preparing the ground for further discussion, conclusions, and recommendations in subsequent chapters.
References
- Chapter 4 - Correlational Research - Studocu
- Chapter 4 - Research Parts Guide - SlideShare
- The Elements of Chapter 4 - Navigating The Dissertation
- Correlational Research - Scribbr
- Correlational Research - Open Textbooks for Hongc
- Correlational Research Overview - Formpl Blog
More
Last updated February 19, 2025