
Overview of Chart Results
A detailed insight into various charts and their outcomes
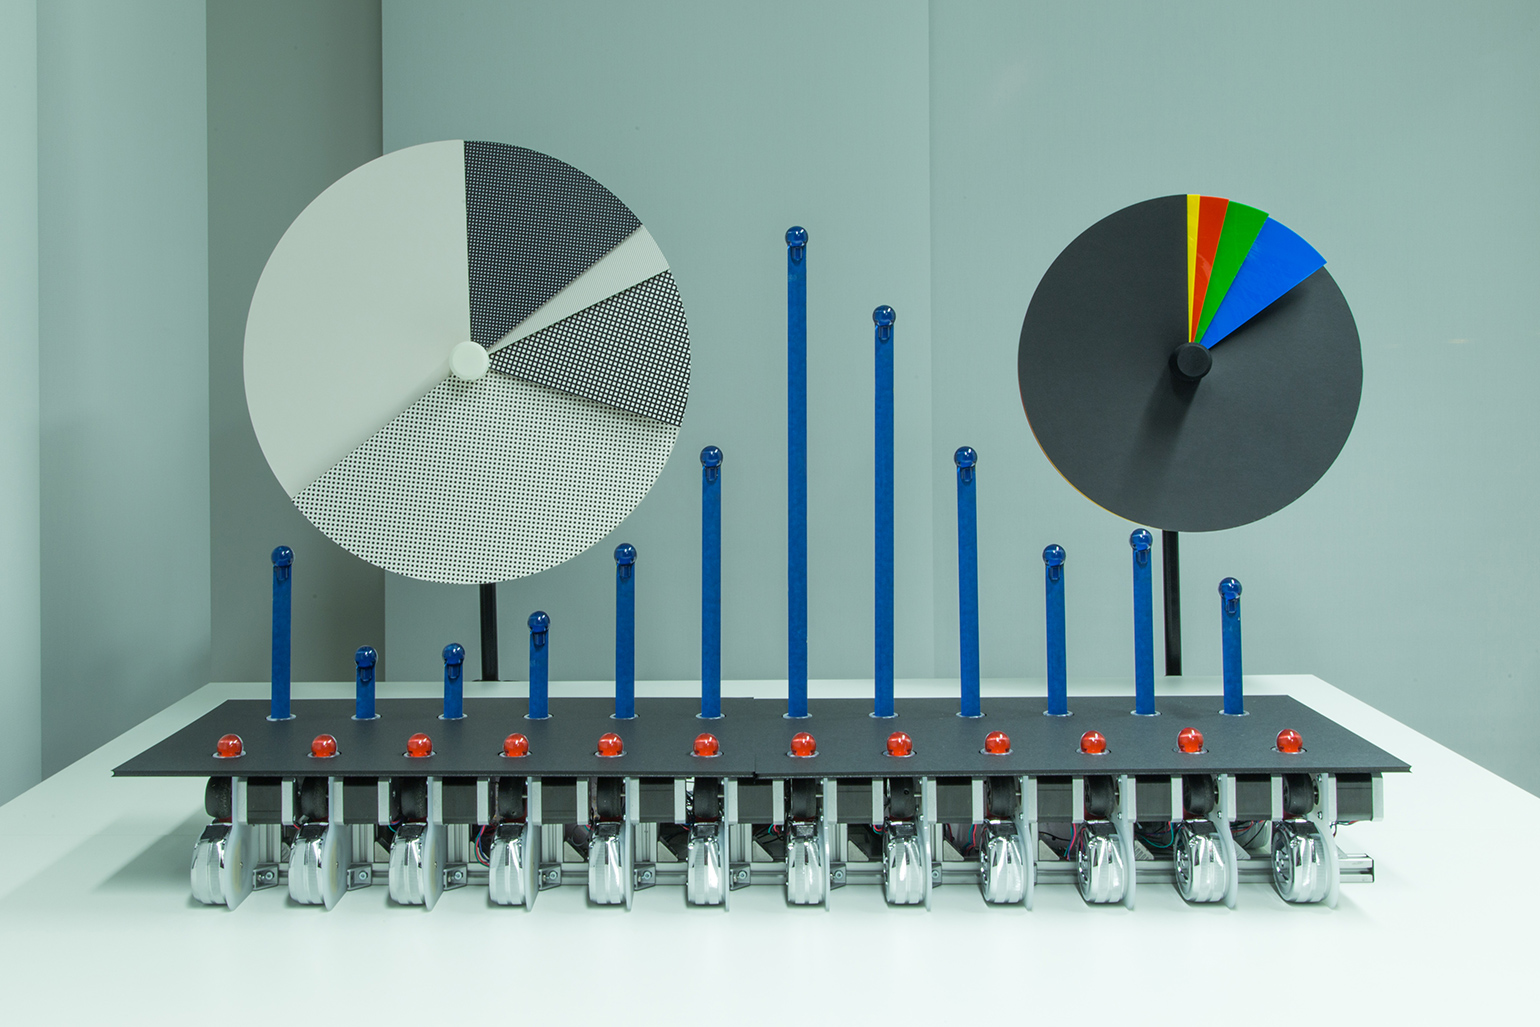
Key Highlights
- Electoral and Financial Insights: Comprehensive results show the election outcomes and business performance metrics.
- Music Chart Trends: Diverse ranking systems across global platforms highlight the prevailing popular tracks and artists.
- Data Visualization Techniques: Various chart types like bar, line, pie, and more provide tailored insights for different data sets.
Introduction
Charts are essential tools that convert complex data into visual representations, making it easier to identify trends, compare categories, and spot fluctuations. In the current context, we will review several prominent chart types and their significant results, ranging from political outcomes and financial performance to international music charts and data visualization techniques employed by analysts and professionals. The information encapsulated here is drawn from diverse categories, providing a detailed picture of how charts help in reporting election data, music trends, financial results, and more.
Detailed Analysis
Electoral Results Overview
US Presidential Election 2024
In the recent US Presidential Election of 2024, the charts detailing the electoral outcomes provide an in-depth view into the voting patterns and shifts across states. One of the crucial aspects of these charts is highlighting the difference between the popular and electoral votes.
The results indicate that one candidate secured a total of 312 electoral votes against the opponent’s 226 votes. The popular vote percentages further reinforce the competitive nature of the election – with the overall winner obtaining approximately 49.9% of the popular vote, and the opposing candidate receiving about 48.3%. Notably, several states that were pivotal in previous elections notably flipped, including pivotal regions like Arizona, Nevada, Michigan, Wisconsin, Pennsylvania, and Georgia. These flips reflect localized voter dynamics that can significantly influence the total electoral count.
Music Charts Analysis
Billboard Hot 100
The Billboard Hot 100 remains a key indicator of music popularity in the United States. This chart aggregates data from streaming services, radio airplay, and digital music sales, presenting a comprehensive picture of what is trending. For instance, songs like "Not Like Us" by Kendrick Lamar have accrued significant momentum, often occupying top positions. The dynamic nature of this chart is evident from weekly updates that track shifts in the public's musical preference.
Another important observation is that collaboration tracks often show up with strong performances; for example, collaborations involving popular artists such as Bruno Mars, Drake, and Lady Gaga have made notable appearances. Platforms like the American Top 40, which also showcase this data, affirm that cross-platform popularity contributes to chart standings.
Official UK Singles Chart
Across the Atlantic, the Official UK Singles Chart is a reliable barometer of music trends in the United Kingdom. It integrates data from various sources including streams (both audio and video), physical downloads, CDs, and even vinyl sales. Sponsoring a holistic approach, this chart ensures that all formats of music consumption are represented. Although the top specific tracks may vary on a weekly basis, similar to their US counterparts, there is considerable overlap in the type of hit tracks, indicating that global trends in music taste are increasingly interconnected.
Apple Music and Digital Platforms
Modern digital streaming services like Apple Music and Spotify drive another critical segment of the music charts. Apple Music, for instance, has its Top Songs chart with "NOKIA" by Drake leading the pack, followed by other major hits such as "Not Like Us" by Kendrick Lamar. These platforms update their charts almost daily, ensuring that the most accurate picture of current listener preferences is always available. The seamless integration of digital sales, streaming activity and user interactions provides a multi-dimensional perspective on what drives popularity in the modern music scene.
Financial and Corporate Performance Charts
Earnings and Sectoral Trends
Businesses and investors rely on financial charts to gauge performance metrics over specified time periods. The financial results chart from the recent quarter (Q3 FY24-25) is particularly insightful, showing that the majority of companies have released their results. For example, of the total companies expected to report, a significant majority have published their quarterly performance data.
Key indicators such as Year-on-Year Growth (YoY) for both revenue and net profit provide an understanding of overall economic trends. With revenue showing a YoY increase of approximately 6.92% and net profit demonstrating an even higher growth rate of around 12.05%, stakeholders are given clear insights into corporate health and growth. In such financial charts, companies within the Containers & Packaging sector have performed the best, while markets like Photographic Products have underperformed, indicating shifts in market demand and industry stability.
Comparative Data Across Companies
A typical summary chart in the financial sector compares various metrics across companies, such as revenue growth, profit margins, and sector performance. For instance, a comparison bar chart might include multiple bars representing individual companies within the same industry, providing a clear visual depiction of which businesses are excelling and which are lagging.
Data Visualization Techniques and Chart Types
Common Chart Types
Charts come in various formats, each designed to serve specific data visualization needs:
- Bar Charts: Effective for comparing values across discrete categories. Each bar’s length represents a quantitative value, making them ideal for displaying sales figures, market share, or other categorical data.
- Line Charts: These are particularly well-suited for showing trends over time. By connecting data points with a continuous line, they highlight patterns, seasonal trends, and progression.
- Pie Charts: These showcase the proportions of a whole by breaking down a circular chart into sectors. They are most commonly used to depict percentage shares in a dataset, such as market share among competitors.
- Gantt Charts: Frequently employed in project management, these charts display the duration of tasks over time and help track project milestones.
- Waterfall Charts: Useful for understanding sequential data, particularly in financial analysis to depict positive and negative changes in value over time.
- Funnel Charts: Ideal for representing stages within a process, such as conversion in sales pipelines or customer onboarding stages.
- Bullet Charts: These provide a way to compare a primary measure against a target figure, often used for performance benchmarking.
Practical Examples of Chart Usage
To illustrate the practical application of these chart types, consider the following examples:
Example 1: Sales Comparison Using a Bar Chart
Imagine data showing board game sales over a six-month period for multiple games. A bar chart can compare the monthly sales performance across different game titles.
| Game | January | February | March | April | May | June |
|---|---|---|---|---|---|---|
| Boggle | 20 | 25 | 30 | 35 | 40 | 45 |
| Code Names | 30 | 35 | 40 | 45 | 50 | 55 |
| Ticket to Ride | 25 | 30 | 35 | 40 | 45 | 50 |
This table exemplifies how a bar chart can be used to compare trends and identify which product is gaining traction over the months.
Example 2: Website Traffic Analysis with a Line Chart
Consider a scenario where web traffic data is collected over six months:
| Month | Traffic |
|---|---|
| January | 1,000 |
| February | 1,200 |
| March | 1,500 |
| April | 1,800 |
| May | 2,000 |
| June | 2,200 |
Here, a line chart would effectively display the upward trajectory of website traffic, clearly showing how data points connect over time to form a trend line.
Integrating Multiple Chart Results
Synthesis of Election, Music, and Financial Data
By combining charts from widely varying domains, analysts and decision-makers can glean comprehensive insights. For example, juxtaposing election results with financial performance charts allows for an understanding of how political climates may affect markets and consumer behavior. Similarly, comparing results from different music charts (Billboard, Official UK Singles, and Apple Music) offers insight into cross-market trends and cultural influence.
In the case of election data, column and bar charts serve as excellent tools for illustrating state-level changes and the overall distribution of electoral votes. When paired with percentage breakdowns of the popular vote, these visualizations offer nuanced perspectives that inform future campaign strategies.
In the financial realm, waterfall charts offer a clear representation of incremental changes in performance whereby companies report a positive spike in one quarter followed by seasonal dips. Such charts are integral to complete quarterly and annual performance reviews, assisting stakeholders to make informed investment decisions.
Advanced Visualization Techniques
Customizing Chart Displays
Advances in data visualization allow for customization based on user needs. Analysts can now incorporate interactive dashboards where users can toggle between different views such as zooming into specific time periods, filtering data categories, and even switching between chart types (e.g., from bar to pie charts).
Customization brings clarity when dealing with complex datasets including multi-dimensional performance indicators. For example, an all-inclusive dashboard might feature several integrated charts: a bar chart summarizing quarterly sales, a line chart identifying traffic trends over time, and a pie chart summarizing market share distribution.
Integration of Real-Time Data
One of the most exciting developments recently in the field of data visualization is the ability to incorporate real-time data into charts. Financial analysts, for instance, are now able to monitor live market data where charts update instantly as new information is released. Real-time music charts and social media trending charts allow fans and industry experts alike to track the latest trends instantly.
Comparative Analysis: Charting Today’s Data
The current charts across various domains show both stability and dynamic shifts:
- In the political realm: The US Presidential Election charts underscore a narrow but significant divide in popular vote metrics, while state-level variations highlight regional influences.
- In music charts: Rankings on platforms such as Billboard Hot 100 and Apple Music establish a clear picture of collaboration-driven successes and evolving listener preferences. The prominence of tracks by artists like Kendrick Lamar, Drake, and Bruno Mars demonstrates the impact of high-profile partnerships.
- In finance: Sector-specific charts illustrate that while some industries display robust growth, others may be facing challenges, inviting a closer look into underlying economic conditions.
Each of these chart types serves a distinct purpose, yet when considered collectively, they provide a multi-faceted perspective on current trends and future directions.
Conclusion
In conclusion, charts remain an indispensable tool across numerous sectors, allowing us to quickly decipher complex information and make evidence-based decisions. Whether illustrating the competitiveness of political elections, the rapid rise of popular music hits, or the intricacies of financial performance, each chart type offers distinct advantages. Bar, line, pie, waterfall, and other chart formats are uniquely designed to address specific analytical needs, ensuring that data is both accessible and insightful.
The significant takeaway is the role of effective data visualization in bridging the gap between raw data and informed decision-making. For individuals ranging from market analysts to political strategists, understanding and interpreting chart results is now more critical than ever. With the growing integration of real-time updates and interactive dashboards, charts are evolving to meet the demands of modern analytics, signifying an era where clarity, precision, and adaptability form the foundation of insightful data interpretation.
References
- Reuters: US Election Results - Reuters
- Moneycontrol: Earnings - Moneycontrol
- Billboard Hot 100 - Billboard
- American Top 40 - American Top 40
- Official UK Singles Chart - Official Charts
- Apple Music Charts - Apple
- ESPN MLB Depth Charts - ESPN
Recommended Queries
Last updated February 22, 2025