
Understanding the Chi-Square Distribution
An in-depth exploration of its fundamentals, properties, and applications
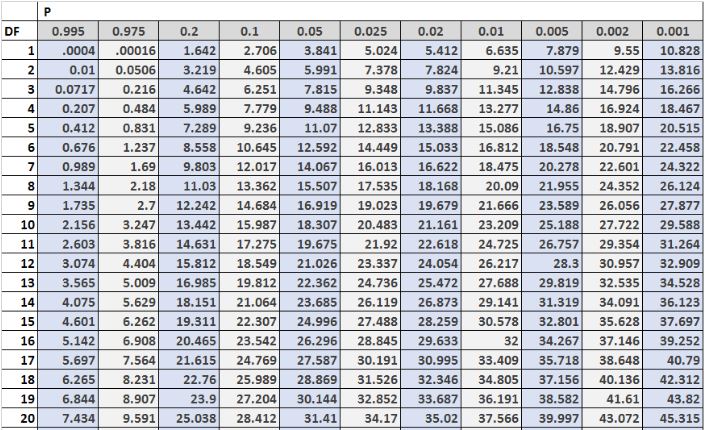
Key Insights
- Definition and Origin: Derived from the sum of squares of standard normal variables, the chi-square distribution is fundamental in statistical hypothesis testing.
- Core Uses: It is pivotal in goodness-of-fit tests, tests for independence in contingency tables, and constructing confidence intervals, among other applications.
- Properties: As a right-skewed distribution with mean equal to its degrees of freedom and variance twice that number, it transforms with an increase in degrees of freedom.
Introduction to the Chi-Square Distribution
The chi-square distribution is one of the most important continuous probability distributions in statistics. It is a fundamental tool used primarily in hypothesis testing, where its primary role is to evaluate the discrepancy between observed and expected frequencies. This distribution is defined by the sum of the squares of independent standard normal random variables. Formally, if we let \( X_1, X_2, \dots, X_k \) be independent variables following a standard normal distribution (i.e., with mean 0 and standard deviation 1), then the random variable \[ \chi^2 = \sum_{i=1}^{k} X_i^2 \] follows a chi-square distribution with \( k \) degrees of freedom.
Fundamental Characteristics
Definition and Derivation
The chi-square distribution originates from the study of normally distributed variables. When the squares of independent standard normal variables are summed, the resulting distribution is always positively skewed, implying that it is defined only on the non-negative real numbers. The parameter that defines the chi-square distribution is the degrees of freedom (\( k \)), which has statistical significance in terms of the number of independent pieces of information upon which the statistic is based.
Mathematical Properties
Several mathematical properties underline the importance of this distribution:
Mean and Variance
The mean (expected value) of the chi-square distribution is equal to the degrees of freedom, \(k\):
\( \mathbb{E}[\chi^2] = k \)
Its variance is given by:
\( \text{Var}[\chi^2] = 2k \)
Shape and Behavior with Changing Degrees of Freedom
For a low number of degrees of freedom, the chi-square distribution is highly right-skewed; most of its probability mass is concentrated at lower values with a long tail extending to high values. As the degrees of freedom increase, the distribution gradually begins to resemble the normal distribution, becoming more symmetric.
Relationship with the Gamma Distribution
The chi-square distribution is a special case of the gamma distribution. Specifically, if a random variable \(X\) follows a chi-square distribution with \(k\) degrees of freedom, then \(X \sim \Gamma\left(\frac{k}{2}, \frac{1}{2}\right)\). This close relationship allows for flexible analytical tools and the extension of chi-square-based methods in broader statistical contexts.
Applications and Uses
Hypothesis Testing
One of the most prominent uses of the chi-square distribution lies in hypothesis testing:
Goodness-of-Fit Test
The chi-square goodness-of-fit test is used to determine whether an observed frequency distribution differs significantly from a theoretical or expected distribution. For example, it can assess if the patterns in voting behaviors or consumer preferences conform to a specified distribution model. In this test, the discrepancy between observed and expected counts is squared, summed, and compared against a critical value from the chi-square distribution.
Test of Independence in Contingency Tables
Chi-square tests for independence analyze whether two categorical variables are related. By comparing observed frequencies in contingency tables with expected frequencies, researchers can determine if the variations are due to chance or indicate a significant association. This is especially useful in fields like social sciences, medicine, and market research.
Estimation and Confidence Intervals
Another important application involves making inferences about population variances. When estimating the standard deviation or variance of a normally distributed population, the chi-square distribution is instrumental in constructing confidence intervals for these parameters. This application is crucial in quality control, experimental sciences, and various types of research studies.
Model Testing and Validation
In more advanced statistical modeling, the chi-square distribution plays a critical role in model testing:
For instance, in regression analysis and analysis of variance (ANOVA), the chi-square distribution is a component underlying the F-distribution. It is used to determine if the additional parameters in a complex model significantly improve the fit of a model over a simpler one, ensuring robust inferential techniques in econometrics and other quantitative research methodologies.
Applications Across Disciplines
The application of the chi-square distribution extends far beyond traditional statistical fields. Here are some examples:
Social Sciences and Market Research
In the social sciences, the chi-square test is popular for analyzing survey data and social behavior. Researchers use it to determine if demographic characteristics (such as age, gender, education) influence voting patterns or consumer preferences. This makes the chi-square test essential for market segmentation and targeted marketing strategies.
Medical and Biological Sciences
In medicine and biology, the chi-square distribution is used in genetics (for instance, to evaluate Mendelian inheritance patterns) and in clinical trials to assess the independence of categorical outcomes. It facilitates the analysis of experimental data, ensuring that observed effects are statistically significant.
Economics and Finance
Economists use chi-square tests to analyze relationships between categorical economic indicators, such as employment status across different groups, consumer spending patterns, and other market trends. This helps in validating models of economic behavior and in strategic decision-making.
Educational Research
The chi-square distribution is similarly useful in educational research where it assists in determining the association between variables such as teaching methods and student performance. Comparative studies rely on these tests to validate theoretical models about learning styles and educational achievements.
Comprehensive Table of Chi-Square Distribution Characteristics and Applications
| Characteristic/Use | Description | Examples/Fields |
|---|---|---|
| Definition | Sum of squares of k independent standard normal variables | Mathematical derivation, simulation |
| Mean & Variance | \( \mathbb{E}[\chi^2] = k \) and \( \text{Var}[\chi^2] = 2k \) | Statistical inference, error estimation |
| Goodness-of-Fit Test | Compares observed and expected frequencies | Voting patterns, consumer behavior |
| Test of Independence | Determines if there is an association between two categorical variables | Survey analysis, medical studies |
| Estimation of Variance | Used for constructing confidence intervals for population variance | Quality control, experimental research |
| Relation to Gamma Distribution | Special case of the gamma distribution with parameters \( \frac{k}{2} \) and \( \frac{1}{2} \) | Theoretical research |
| Advanced Model Testing | Component in F-distribution for regression and ANOVA | Econometrics, scientific studies |
Detailed Considerations in Practical Applications
Goodness-of-Fit Testing
In practical statistics, determining how well a theoretical model fits the observed data is key to verifying hypotheses. The chi-square goodness-of-fit test computes the following test statistic:
\[ \chi^2 = \sum_{i=1}^{n} \frac{(O_i - E_i)^2}{E_i} \]
Here, \( O_i \) represents the observed frequency for category \( i \) and \( E_i \) represents the expected frequency under the assumed model. The resulting computed value is then compared to a critical value from the chi-square distribution table based on the desired significance level (\( \alpha \)) and the degrees of freedom. This method is robust and widely implemented in various research settings.
Chi-Square Test of Independence
Another fundamental application of the chi-square distribution is the test of independence, which is used to assess whether two categorical variables are statistically independent. Researchers typically organize the data into a contingency table that displays the frequency of observations for each combination of categories. The chi-square test then evaluates whether the observed frequencies deviate significantly from what would be expected if the two variables were entirely independent.
For example, consider a study on consumer behavior where the relationship between age groups and product preference is to be analyzed. A contingency table organizes the data, and applying the chi-square test produces a statistic that, if statistically significant, indicates that product preference is associated with age.
Advanced Statistical Modeling
Beyond hypothesis testing, the chi-square distribution plays a significant role in advanced statistical modeling. The distribution's property of being asymptotically normal for high degrees of freedom allows it to be integrated into a variety of complex models. In regression analysis, for instance, the derivation of test statistics for model comparisons often involves chi-square metrics. Furthermore, the chi-square distribution contributes to the formation of the F-distribution—an essential component in analysis of variance (ANOVA). By understanding these statistical relationships, researchers can design robust models that efficiently test the validity of theoretical constructs.
Confidence Intervals for Variance
In many scenarios, particularly in quality control and experimental design, it becomes necessary to estimate the variability or dispersion in a dataset. The chi-square distribution’s role in constructing confidence intervals for a population variance is essential. Given a sample variance \( s^2 \) from a normally distributed sample of size \( n \), the confidence interval for the true variance \( \sigma^2 \) is constructed using the chi-square distribution by:
\[ \left( \frac{(n-1)s^2}{\chi^2_{\alpha/2, n-1}}, \frac{(n-1)s^2}{\chi^2_{1-\alpha/2, n-1}} \right) \]
This method provides a statistically rigorous approach for quantifying uncertainty in estimations of variability.
Practical Implementation and Examples
Using Software for Chi-Square Tests
With advancements in computational tools, performing chi-square tests has become increasingly accessible. Modern statistical software packages (like R, Python’s SciPy, SPSS, and SAS) include built-in functions to compute chi-square statistics as well as p-values. These functions handle everything from goodness-of-fit tests to complex contingency table analyses.
For example, in Python, one might use the following code snippet:
# Import the necessary module
import scipy.stats as stats

# Define observed and expected frequencies
observed = [50, 30, 20]
expected = [40, 40, 20]

# Perform the chi-square test
chi2_stat, p_val = stats.chisquare(f_obs=observed, f_exp=expected)

# Output the results
print("Chi-square Statistic:", chi2_stat)
print("p-value:", p_val)
This code illustrates a practical implementation in Python using the SciPy library.
Interpretation of Results
The key to using the chi-square distribution effectively is in the interpretation of the computed test statistic. A statistically significant chi-square value suggests that the observed differences between the actual frequencies and those expected under the null hypothesis are too large to be attributed to random variation alone. This rejection of the null hypothesis supports the alternate hypothesis that an association or difference exists.
The significance level, often set at 0.05, is used to determine the threshold below which the null hypothesis can be rejected. It is imperative in practical settings to complement the chi-square calculation with a careful analysis of the sample size, degrees of freedom, and expected frequency conditions.
References
- Chi-squared distribution - Wikipedia
- Chi-Square Statistic: How to Calculate It / Distribution - StatisticHowTo
- Chi-Square (χ²) Distributions | Definition & Examples - Scribbr
- Chi-Square (χ²) Statistic: What It Is, Examples, How and When to Use It - Investopedia
- Chi-Square Test: Formula, Types, & Examples - Simplilearn
Related Queries for Further Exploration
Last updated March 13, 2025