
NPV vs. IRR: Unveiling the Best Metric for Your Investment Decisions
A deep dive into how Net Present Value and Internal Rate of Return can guide your financial strategy, highlighting their strengths and weaknesses.
Net Present Value (NPV) and Internal Rate of Return (IRR) are two cornerstone metrics in the world of finance, particularly crucial for capital budgeting and evaluating the profitability of potential investments. While both aim to guide decision-makers toward sound financial choices, they offer distinct perspectives and insights. Understanding their nuances, how they are calculated, and their respective advantages and limitations is paramount for effective financial analysis and strategic planning.
Key Highlights: NPV vs. IRR at a Glance
- NPV provides an absolute measure of value: It calculates the dollar amount an investment is expected to add to a company, making it a direct indicator of wealth creation.
- IRR offers a relative measure of return: It expresses an investment's profitability as a percentage, which can be intuitive for comparing the efficiency of different projects.
- Fundamental differences in assumptions: The most critical distinction lies in their reinvestment rate assumptions, which can lead to conflicting project rankings, especially for mutually exclusive investments.
Decoding the Metrics: What Are NPV and IRR?
Both NPV and IRR are discounted cash flow (DCF) techniques, meaning they account for the time value of money – the principle that a dollar today is worth more than a dollar tomorrow due to potential earning capacity and inflation. They are used extensively to assess whether an investment is likely to generate a return that justifies its cost.
Net Present Value (NPV)
NPV is an absolute measure that quantifies the difference between the present value of all expected future cash inflows and the present value of all cash outflows associated with an investment, discounted at a specific rate (usually the company's weighted average cost of capital, WACC, or a predetermined hurdle rate). Essentially, it tells you the net gain or loss in today's dollars that an investment is projected to generate over its lifespan.
The NPV Formula
The formula for NPV is:
\[ NPV = \sum_{t=0}^{N} \frac{C_t}{(1+r)^t} \]Where:
- \(C_t\) = Net cash flow during period \(t\) (cash inflow minus cash outflow)
- \(r\) = Discount rate per period
- \(N\) = Total number of periods (the life of the investment)
- \(t\) = The time period of the cash flow
Typically, \(C_0\) represents the initial investment, which is a negative cash flow.
Interpreting NPV
The decision rule for NPV is straightforward:
- Positive NPV: The investment is expected to generate more value than it costs, in present value terms. Generally, such projects are considered acceptable as they are anticipated to increase firm value.
- Negative NPV: The investment is expected to result in a net loss in present value terms. These projects are typically rejected.
- Zero NPV: The investment is expected to generate returns exactly equal to the discount rate. The decision to proceed might depend on non-financial factors.
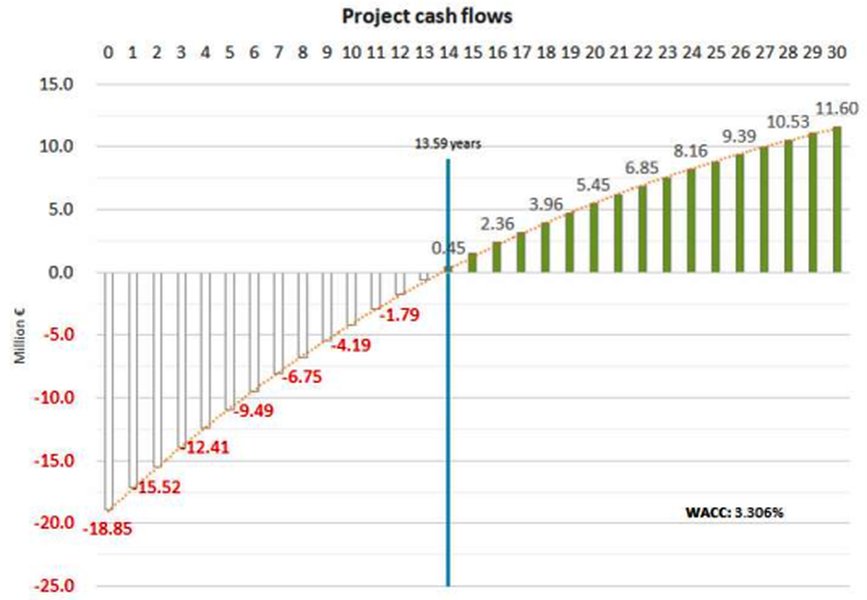
An example of a cash flow diagram used in NPV and IRR calculations, showing initial investment and subsequent cash inflows over time.
Internal Rate of Return (IRR)
IRR is the discount rate at which the Net Present Value (NPV) of all cash flows (both inflows and outflows) from a particular investment equals zero. In simpler terms, it's the effective annualized rate of return that an investment is expected to yield. It represents the break-even discount rate; if the company's cost of capital is below the IRR, the project is generally considered profitable.
Finding the IRR
The IRR is found by solving the following equation for the IRR value:
\[ 0 = NPV = \sum_{t=0}^{N} \frac{C_t}{(1+IRR)^t} \]This equation usually cannot be solved directly and requires iterative methods, financial calculators, or spreadsheet software (like Excel's IRR function).
Interpreting IRR
The decision rule for IRR involves comparing it to a predetermined required rate of return or hurdle rate (often the WACC):
- IRR > Hurdle Rate: The project's expected rate of return is higher than the cost of financing it. Such projects are generally considered acceptable.
- IRR < Hurdle Rate: The project's expected rate of return is lower than the cost of financing. These projects are typically rejected.
- IRR = Hurdle Rate: The project is expected to earn a return equal to the cost of capital.
NPV vs. IRR: A Head-to-Head Comparison
While both NPV and IRR evaluate investment profitability, they do so from different angles and possess distinct characteristics. Understanding these differences is crucial for making informed capital allocation decisions.
Output and Interpretation
NPV provides an absolute value – a specific monetary amount (e.g., dollars, euros) that the project is expected to add to the company's wealth. This makes it a direct measure of the impact on firm value. IRR, on the other hand, yields a percentage rate, which is often more intuitive for stakeholders to understand as a rate of return. It shows the project's intrinsic earning power.
Reinvestment Rate Assumption
This is one of the most significant theoretical differences and a common point of debate:
- NPV implicitly assumes that any intermediate positive cash flows generated by the project are reinvested at the discount rate used in the NPV calculation (i.e., the firm's cost of capital or hurdle rate). This is generally considered a more realistic assumption, as it reflects the rate at which the firm can typically reinvest funds.
- IRR implicitly assumes that intermediate cash flows are reinvested at the IRR itself. If the IRR is very high, this assumption can be overly optimistic and may not be achievable in practice, potentially leading to an overestimation of the project's true profitability.
Handling of Cash Flow Patterns
- NPV is generally more robust and reliable when dealing with non-conventional (or irregular) cash flows. These are projects where cash flows change signs more than once during the project's life (e.g., an initial outflow, followed by inflows, then another outflow for decommissioning).
- IRR can encounter problems with non-conventional cash flows. It might yield multiple IRR values for a single project, or in some cases, no real IRR at all. This "multiple IRR problem" can make the IRR metric ambiguous or unusable in such scenarios.
Mutually Exclusive Projects
When evaluating mutually exclusive projects (where choosing one project means foregoing others), NPV and IRR can sometimes provide conflicting rankings. For instance, a project with a higher IRR might have a lower NPV, and vice versa. This typically occurs when projects differ significantly in scale (initial investment size) or timing of cash flows.
In such conflict situations, NPV is generally considered the superior decision criterion. This is because NPV directly measures the absolute increase in shareholder wealth, which is the primary goal of most corporations. IRR, being a relative measure, might favor smaller projects with high percentage returns but lower absolute value creation compared to larger projects with lower IRRs but higher NPVs.
Sensitivity to Discount Rate
NPV is directly dependent on the chosen discount rate; changing the discount rate will change the NPV. The IRR, by its definition, is the discount rate that makes NPV zero, so it's not dependent on an external discount rate for its calculation but is compared against one for decision-making.
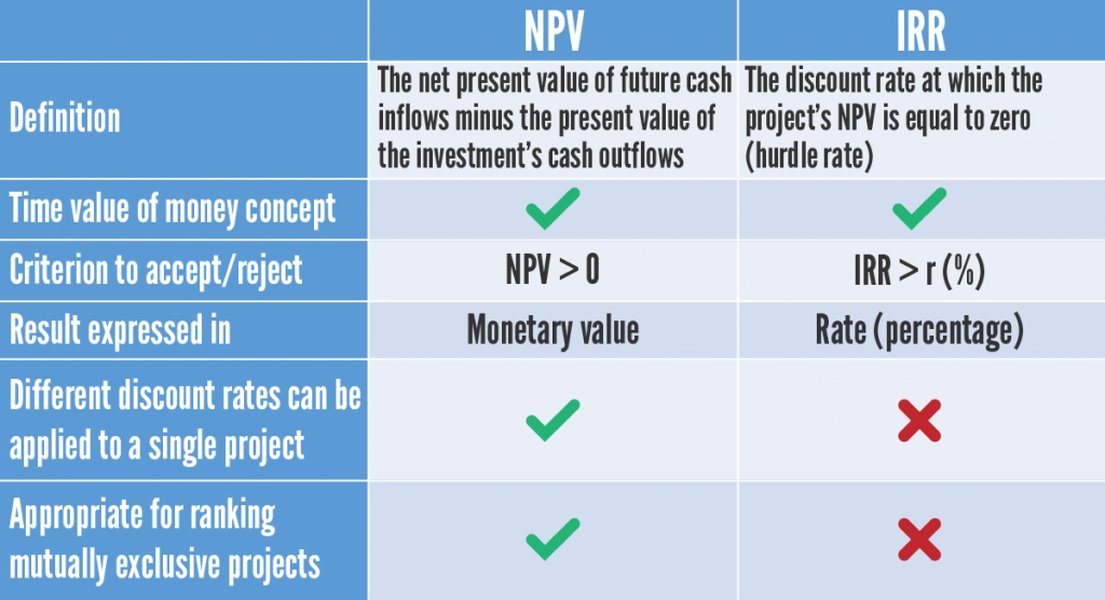
A summary table highlighting key differences and features of NPV and IRR.
Visualizing the Comparison: NPV vs. IRR Attributes
The radar chart below provides a visual comparison of NPV and IRR across several key attributes relevant to investment appraisal. The scores (out of 10, with 10 being most favorable) reflect a general consensus on the strengths and weaknesses of each metric in different analytical contexts. This is an opinionated analysis intended to illustrate relative performance.
This chart illustrates that NPV generally scores higher on aspects like realistic reinvestment assumptions and reliability for mutually exclusive projects, while IRR is often perceived as easier to understand due to its percentage format.
Interconnected Concepts: A Mindmap View
The following mindmap illustrates the core concepts of NPV and IRR and how they relate to broader investment appraisal. It highlights their definitions, decision rules, and key differentiating factors, such as reinvestment assumptions and handling of project conflicts.
This mindmap visually organizes the key attributes and relationships between NPV and IRR, emphasizing their roles in financial decision-making.
Advantages and Disadvantages Summarized
Both NPV and IRR have their own set of strengths and weaknesses that make them more or less suitable for different situations.
| Feature | Net Present Value (NPV) | Internal Rate of Return (IRR) |
|---|---|---|
| Metric Type | Absolute monetary value (e.g., dollars) | Percentage rate of return |
| Primary Advantage | Directly measures the increase in firm value. Consistent with shareholder wealth maximization. More reliable for ranking mutually exclusive projects. Realistic reinvestment rate assumption. | Intuitive and easy to understand as a percentage return. Useful for comparing projects of different sizes (though can be misleading). Does not require an external discount rate for calculation (only for decision). |
| Primary Disadvantage | Requires an accurate estimation of the discount rate, which can be challenging. May not be as intuitively understood as a percentage. | Can yield multiple IRRs or no IRR for projects with non-conventional cash flows. Unrealistic reinvestment rate assumption (at the IRR). Can lead to incorrect decisions when comparing mutually exclusive projects of different scales or lifespans. |
| Reinvestment Assumption | Intermediate cash flows reinvested at the discount rate (cost of capital). | Intermediate cash flows reinvested at the IRR. |
| Mutually Exclusive Projects | Generally preferred as it selects the project that adds most value. | Can be misleading due to scale or timing differences; may rank projects incorrectly. |
| Non-Conventional Cash Flows | Handles them effectively. | Potential for multiple IRRs or no solution. |
This table provides a concise summary of the key characteristics, pros, and cons of NPV and IRR.
NPV and IRR Explained: A Video Deep Dive
For a more dynamic explanation of NPV and IRR, including their purposes, calculation methods, and how they are used in investment analysis, the following video offers valuable insights. It covers the core concepts discussed and helps visualize their application in finance.
This video, "NPV and IRR explained," elaborates on the practical application of these crucial capital budgeting techniques, reinforcing the concepts with examples and clear explanations. It's a helpful resource for understanding how these metrics guide investment decisions.
When to Prefer Which Metric?
While financial analysts often use both NPV and IRR in conjunction, there are scenarios where one might be more appropriate or reliable than the other.
Lean on NPV When:
- Comparing mutually exclusive projects: NPV is superior as it indicates which project will add more absolute value to the firm.
- The goal is to maximize shareholder wealth: NPV directly measures the dollar value impact on the firm.
- Projects have non-conventional cash flows: NPV provides a unique, reliable value, whereas IRR might be problematic.
- Discount rates vary over the project's life: NPV can more easily accommodate changing discount rates (Modified NPV).
- The scale of projects differs significantly: NPV properly accounts for the size of the investment and its absolute return.
Consider IRR When:
- Communicating returns to stakeholders: A percentage return is often more intuitive and easier to grasp than an absolute dollar figure.
- Quickly screening multiple independent projects: IRR can be a useful first-pass filter, especially if projects have similar characteristics and conventional cash flows.
- The appropriate discount rate is uncertain: IRR provides the project's break-even rate of return, which can then be compared to various potential costs of capital.
- Comparing projects of roughly similar scale and duration with conventional cash flows: In these cases, IRR can provide a useful comparative measure of efficiency.
In practice, it's wise not to rely on a single metric. Most financial professionals use NPV as the primary decision tool, especially for significant investments, and supplement it with IRR and other metrics like payback period and profitability index for a more holistic view.
Frequently Asked Questions (FAQ)
What is the "time value of money" and why is it important for NPV and IRR?
The time value of money (TVM) is the concept that a sum of money is worth more now than the same sum will be at a future date due to its potential earning capacity. This core principle in finance holds that money can earn interest, so any amount of money is worth more the sooner it is received. Both NPV and IRR are discounted cash flow (DCF) methods, meaning they explicitly incorporate TVM by discounting future cash flows back to their present values. This allows for a more accurate comparison of investments with cash flows occurring at different points in time.
Why is the reinvestment rate assumption a critical difference between NPV and IRR?
The reinvestment rate assumption is critical because it affects how the profitability of a project is perceived. NPV assumes that intermediate cash flows are reinvested at the firm's cost of capital (the discount rate). This is generally considered more realistic because the cost of capital often reflects the rate at which a company can obtain and reinvest funds in the market. IRR, however, assumes reinvestment at the IRR itself. If a project has a very high IRR (e.g., 30%), this implies that all cash flows generated by the project can also be reinvested to earn 30%, which may not be feasible in reality. This can lead to an overestimation of the project's attractiveness when using IRR, especially when comparing it to NPV for mutually exclusive projects.
Can NPV and IRR lead to conflicting investment decisions? If so, why?
Yes, NPV and IRR can lead to conflicting investment decisions, particularly when evaluating mutually exclusive projects (i.e., you can only choose one). Conflicts arise primarily due to differences in:
1. Scale of Investment: A smaller project might have a higher IRR (percentage return), but a larger project might have a higher NPV (absolute dollar return). If the goal is to maximize firm value, the higher NPV project is preferred.
2. Timing of Cash Flows: Projects with cash flows received earlier might have higher IRRs because of the compounding effect in the IRR's reinvestment assumption, even if their total NPV is lower than a project with later cash flows.
3. Reinvestment Rate Assumptions: As discussed, NPV assumes reinvestment at the cost of capital, while IRR assumes reinvestment at the IRR. This difference can cause rankings to diverge.
In cases of conflict for mutually exclusive projects, financial theory generally recommends relying on the NPV rule because it directly aligns with the objective of maximizing shareholder wealth.
What is the "multiple IRR problem" and when does it occur?
The "multiple IRR problem" occurs when an investment project has non-conventional cash flows. Conventional cash flows typically involve an initial cash outflow (investment) followed by a series of cash inflows. Non-conventional cash flows have more than one change in the sign of cash flows over the project's life (e.g., initial outflow, then inflows, then another outflow perhaps for decommissioning or further investment).
Mathematically, the IRR is a root of a polynomial equation. For projects with non-conventional cash flows, this polynomial can have more than one real, positive root, leading to multiple IRRs. This makes the IRR ambiguous and difficult to interpret for decision-making, as it's unclear which IRR (if any) is the correct one to compare against the hurdle rate. NPV does not suffer from this issue as it always provides a single value for a given discount rate.
Recommended Further Exploration
To deepen your understanding of investment appraisal and related financial concepts, consider exploring these topics:
- How does the choice of discount rate impact NPV calculations and investment decisions?
- What are the advantages of using Modified Internal Rate of Return (MIRR) over traditional IRR?
- Comparing NPV and Payback Period: Which is better for short-term vs. long-term investment analysis?
- How do sensitivity analysis and scenario analysis complement NPV and IRR in project evaluation?
References
This analysis was synthesized from information found in the following resources:
Last updated May 14, 2025