
Comprehensive Guide to Data Analysis from Tables
Unlocking Insights and Driving Decisions through Effective Data Analysis
Key Takeaways
- Understanding Data Analysis Techniques: Comprehensive overview of various data analysis methods to suit diverse objectives.
- Effective Data Preparation: Importance of data cleaning and formatting to ensure accurate and meaningful analysis.
- Utilizing Tools and Features: Leveraging powerful tools like Excel and Google Sheets to perform sophisticated data analyses.
Introduction to Data Analysis
Data analysis is a critical process that involves inspecting, cleaning, transforming, and modeling data to discover useful information, draw conclusions, and support decision-making. Whether you're handling numerical data, categorical data, or a combination of both, effective data analysis can unveil patterns, trends, and relationships that are essential for strategic planning and operational efficiency.
Types of Data Analysis
Descriptive Analysis
Descriptive analysis focuses on summarizing historical data to understand what has happened. It involves calculating measures such as mean, median, mode, standard deviation, and creating visual representations like histograms, boxplots, and pie charts. This type of analysis is foundational, offering a snapshot of the current state of affairs and laying the groundwork for more advanced analyses.
Diagnostic Analysis
Diagnostic analysis delves deeper to determine the causes behind observed outcomes. By identifying correlations and anomalies within the data, this analysis helps in understanding why certain trends or patterns exist. Techniques such as correlation analysis, regression analysis, and root cause analysis are commonly employed to uncover the underlying factors influencing the data.
Predictive Analysis
Predictive analysis leverages historical data to forecast future events or behaviors. Utilizing statistical models and machine learning algorithms, this analysis can predict trends, customer behaviors, market movements, and more. Techniques like time-series forecasting, classification, and regression models are instrumental in making informed predictions that guide strategic decisions.
Inferential Analysis
Inferential analysis involves making inferences about a population based on a sample of data. Through hypothesis testing, confidence intervals, and other statistical methods, this analysis allows for generalizations and conclusions to be drawn from sampled data. It's essential for validating assumptions and making data-driven decisions with a certain level of confidence.
Clustering and Segmentation
Clustering and segmentation techniques group data points into clusters based on similarities. This is particularly useful for customer segmentation, market analysis, and identifying patterns within large datasets. Methods like K-means clustering, hierarchical clustering, and DBSCAN are commonly used to categorize data into meaningful segments.
Time-Series Analysis
Time-series analysis examines data points collected or recorded at specific time intervals. This analysis is vital for identifying trends, seasonal patterns, and cyclical behaviors over time. Techniques such as moving averages, exponential smoothing, and ARIMA models are employed to analyze and forecast temporal data effectively.
Regression Analysis
Regression analysis explores the relationships between dependent and independent variables. By modeling these relationships, it helps in understanding how changes in independent variables impact the dependent variable. Various forms of regression, including linear, multiple, and logistic regression, are utilized to quantify and predict these interactions.
Qualitative Analysis
Qualitative analysis involves interpreting non-numerical data, such as interviews, open-ended survey responses, and observations. This analysis aims to understand underlying motivations, opinions, and behaviors. Techniques like thematic analysis, content analysis, and narrative analysis are employed to systematically analyze qualitative data.
Preparing Your Data for Analysis
Data Cleaning
Before diving into analysis, it's crucial to ensure that your data is clean and free from errors. Data cleaning involves:
- Removing duplicate entries
- Handling missing values through imputation or removal
- Correcting inconsistencies in data formatting
- Validating data accuracy and integrity
A clean dataset ensures that your analysis is reliable and that the insights drawn are based on accurate information.
Data Formatting
Proper data formatting involves organizing data into a consistent structure, making it easier to analyze. This includes:
- Ensuring uniform date and time formats
- Standardizing categorical variables
- Converting data types as necessary (e.g., numeric, text)
- Structuring data in a tabular format with clearly defined columns and rows
Data Transformation
Data transformation involves modifying data into a suitable format or structure for analysis. Common transformation techniques include:
- Normalization and scaling of numerical data
- Encoding categorical variables
- Aggregating data to different levels of granularity
- Creating new derived variables based on existing data
Tools and Features for Data Analysis
Microsoft Excel
Excel is a versatile tool widely used for data analysis due to its extensive range of features and user-friendly interface. Key functionalities include:
Data Tables for What-If Analysis
Excel's What-If analysis tools allow users to create one-variable or two-variable data tables to explore how changes in input variables affect outcomes. This is particularly useful for scenarios like analyzing the impact of different interest rates or loan terms on mortgage payments.
Analyze Data Feature
The Analyze Data feature enables users to ask natural language questions about their data and receive visual summaries, trends, and patterns without the need to write complex formulas. This feature is ideal for quickly understanding data insights.
PivotTables and Charts
PivotTables allow for the summarization of large datasets, enabling users to organize and analyze data efficiently. When combined with charting tools, PivotTables facilitate the creation of dynamic and interactive visualizations that highlight key trends and patterns.
Google Sheets
Google Sheets offers a collaborative platform for data analysis, equipped with a variety of tools and features that enhance analytical capabilities:
Quick Analysis Tools
Google Sheets provides built-in quick analysis features that help users rapidly summarize and visualize data. Functions like SUM, AVERAGE, and built-in charts allow for immediate insights and trend identification.
Data Validation and Conditional Formatting
Data validation ensures data consistency by restricting the type of data that can be entered into a cell. Conditional formatting enhances data visualization by highlighting trends, anomalies, or specific data points based on predefined criteria.
Add-ons and Scripts
Google Sheets supports a wide range of add-ons and custom scripts that extend its functionality. These tools can automate repetitive tasks, integrate with other software, and provide advanced analytical capabilities tailored to specific needs.
Advanced Analytical Tools
For more sophisticated data analysis, specialized software and programming languages offer powerful capabilities:
| Tool | Description | Use Cases |
|---|---|---|
| Python | A versatile programming language with libraries like Pandas, NumPy, and SciPy for data manipulation and analysis. | Data cleaning, statistical analysis, machine learning models. |
| R | A language specifically designed for statistical computing and graphics. | Advanced statistical analysis, data visualization, bioinformatics. |
| Tableau | A powerful data visualization tool that transforms data into interactive and shareable dashboards. | Business intelligence, real-time data visualization, reporting. |
| Power BI | A business analytics service by Microsoft that provides interactive visualizations and business intelligence capabilities. | Data integration, dashboard creation, interactive reports. |
Step-by-Step Guide to Performing Data Analysis
1. Define Your Objectives
Clearly defining the objectives of your data analysis is the first critical step. Determine what questions you aim to answer, the decisions you wish to inform, and the specific outcomes you expect from the analysis. This clarity ensures that your analysis is focused and aligned with your goals.
2. Collect and Prepare Your Data
Gathering the necessary data is essential. Ensure that your data is comprehensive, relevant, and accurately represents the aspects you're analyzing. Once collected, proceed with data cleaning and formatting to prepare the dataset for analysis.
3. Explore and Visualize Your Data
Begin by exploring the data to gain a preliminary understanding. Use descriptive statistics and visualizations to identify patterns, trends, and anomalies. Tools like histograms, scatter plots, and boxplots are invaluable for this exploratory phase.
4. Choose the Appropriate Analysis Techniques
Based on your objectives, select the data analysis techniques that best suit your needs. Whether it's regression analysis to understand relationships between variables or time-series analysis to forecast future trends, choosing the right method is crucial for meaningful insights.
5. Conduct the Analysis
Apply the chosen techniques to your prepared dataset. Use statistical software or tools like Excel and Google Sheets to perform calculations, run models, and generate results. Ensure that each step is methodically executed to maintain the integrity of the analysis.
6. Interpret the Results
Once the analysis is complete, interpret the results in the context of your original objectives. Determine what the findings mean, how they relate to your questions, and what implications they have for your decisions or strategies.
7. Communicate Your Findings
Effective communication of your analysis findings is paramount. Use clear visualizations, concise summaries, and actionable recommendations to convey the insights. Tailor your communication to your audience to ensure that the information is both accessible and impactful.
Advanced Data Analysis Techniques
Regression Analysis
Regression analysis is a statistical method used to examine the relationship between a dependent variable and one or more independent variables. It helps in understanding how changes in independent variables impact the dependent variable. There are various types of regression analysis:
- Linear Regression: Models the linear relationship between variables.
- Multiple Regression: Involves multiple independent variables to predict the dependent variable.
- Logistic Regression: Used for binary dependent variables to predict outcomes like yes/no, success/failure.
Time-Series Forecasting
Time-series forecasting involves analyzing data points collected or recorded at specific time intervals to predict future values. This technique is essential for businesses and organizations to anticipate future trends and plan accordingly. Key methods include:
- Moving Averages: Smooth out short-term fluctuations to identify longer-term trends.
- Exponential Smoothing: Applies weights to past observations, giving more importance to recent data.
- ARIMA Models: Combines autoregressive and moving average components to model temporal data.
Clustering Techniques
Clustering involves grouping a set of objects in such a way that objects in the same group are more similar to each other than to those in other groups. It is widely used in market segmentation, image recognition, and pattern discovery. Common clustering techniques include:
- K-Means Clustering: Divides data into K distinct clusters based on distance to the centroid.
- Hierarchical Clustering: Builds a hierarchy of clusters through agglomerative or divisive methods.
- DBSCAN: Identifies clusters based on density, allowing for noise and varying cluster shapes.
Principal Component Analysis (PCA)
PCA is a dimensionality reduction technique that transforms a large set of variables into a smaller one that still contains most of the information in the large set. It is essential for simplifying datasets, reducing computational costs, and eliminating multicollinearity in regression models.
Machine Learning Models
Machine learning models enable predictive analytics by learning from historical data. These models can identify complex patterns and make accurate predictions. Common machine learning models used in data analysis include:
- Decision Trees: Models that use a tree-like graph of decisions to predict outcomes.
- Random Forests: An ensemble of decision trees that provides more accurate and robust predictions.
- Support Vector Machines (SVM): Supervised learning models used for classification and regression tasks.
- Neural Networks: Inspired by the human brain, they are capable of modeling complex relationships in data.
Data Visualization Techniques
Charts and Graphs
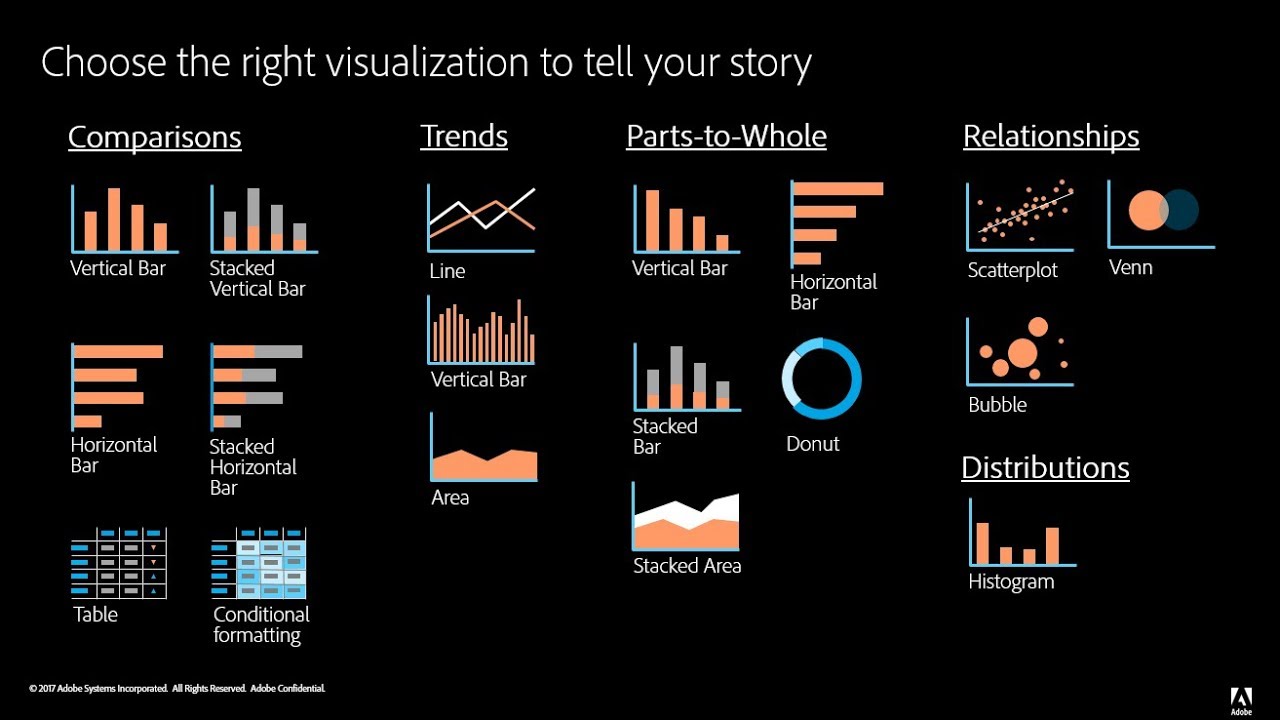
Visual representations of data make it easier to understand and interpret complex information. Common charts and graphs used in data analysis include:
- Bar Charts: Compare quantities across different categories.
- Line Graphs: Show trends over time.
- Pie Charts: Display proportions of a whole.
- Scatter Plots: Illustrate relationships between two variables.
- Heatmaps: Represent data values through variations in color.
Dashboards
Dashboards provide a consolidated view of key metrics and performance indicators using interactive visualizations. They enable quick insights and facilitate real-time decision-making by presenting data in an easily digestible format.
Geospatial Visualizations
Geospatial visualizations map data onto geographical locations, allowing for the analysis of spatial patterns and relationships. Techniques include:
-
Choropleth Maps: Use color shading to represent data values across different regions.
-
Heat Maps: Show the density or intensity of data points in specific areas.
-
Dot Distribution Maps: Represent individual data points as dots to visualize spatial distribution.
Best Practices for Data Analysis
Ensure Data Quality
High-quality data is the cornerstone of accurate analysis. Regularly audit your data sources, validate data entries, and maintain consistency to ensure the reliability of your analysis outcomes.
Choose the Right Tools
Selecting appropriate tools and software tailored to your specific analysis needs can significantly enhance efficiency and accuracy. Familiarize yourself with various data analysis platforms and leverage their unique strengths to your advantage.
Stay Objective
Maintain objectivity throughout the analysis process to avoid biases that can skew results. Approach data with an open mind, allowing the evidence to guide your conclusions rather than preconceived notions.
Communicate Clearly
Present your findings in a clear and concise manner, using visual aids and straightforward language. Effective communication ensures that stakeholders can understand and act upon the insights derived from the data.
Continuously Learn and Adapt
The field of data analysis is constantly evolving with new methodologies, tools, and technologies. Commit to ongoing learning and adapt your strategies to incorporate the latest advancements, ensuring that your analysis remains relevant and effective.
Conclusion
Data analysis is an indispensable component of modern decision-making, enabling individuals and organizations to harness the power of data to drive meaningful outcomes. By understanding and applying various data analysis techniques, preparing data meticulously, leveraging robust tools, and adhering to best practices, you can transform raw data into actionable insights. Whether you are conducting descriptive statistics, diagnostic investigations, predictive modeling, or inferential assessments, a well-executed data analysis process empowers you to make informed decisions, identify opportunities, and navigate challenges with confidence.
References
Last updated January 27, 2025