
Comprehensive Guide to Price Action Trading Methods
In-depth analysis of strategies, probabilities, and risk management
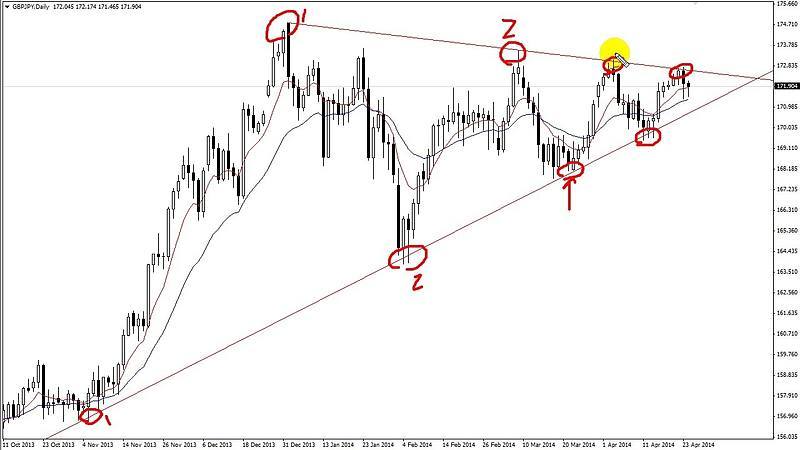
Key Takeaways
- Understanding Diverse Methods: Mastering various price action strategies enhances trading adaptability and success rates.
- Risk-Reward Dynamics: Proper risk management through optimal risk-reward ratios is crucial for long-term profitability.
- Hybrid Approaches Improve Accuracy: Combining multiple strategies increases the probability of successful trades.
1. Trend Trading
Explanation
Trend trading involves identifying and capitalizing on the directional movement of the market, whether it's an uptrend, downtrend, or sideways trend. Traders aim to enter positions aligned with the prevailing trend and exit when signs of reversal emerge.
Example
- Uptrend: A succession of higher highs and higher lows indicates a strong upward trajectory.
- Downtrend: A series of lower highs and lower lows reflects a consistent downward movement.
- Sideways Trend: Price oscillates within a defined range without a clear directional bias.
Advantages
- High probability of success in strong trending markets.
- Simplifies decision-making by following the market direction.
- Applicable across multiple timeframes.
Drawbacks
- False breakouts can result in losses.
- Trends may reverse unexpectedly, especially in volatile conditions.
- Requires patience for trend confirmation.
Best Used
- In markets exhibiting clear and sustained trends.
- Ideal for medium to long-term trading strategies.
Mathematical Probability
The probability of success in trend trading increases significantly in strong trending markets, with an estimated success rate of 60%-70%, but diminishes in choppy or ranging markets.
2. Support and Resistance Levels
Explanation
Support and resistance levels are specific price points where the market historically tends to reverse or consolidate. Support acts as a floor preventing the price from falling further, while resistance serves as a ceiling limiting upward movement.
Example
- Support Level: Price repeatedly bounces off a particular level, indicating strong buying interest.
- Resistance Level: Price consistently fails to break above a certain level, signaling selling pressure.
Advantages
- Provides clear entry and exit points.
- Assists in identifying potential reversals or breakouts.
- Applicable in both trending and ranging markets.
Drawbacks
- Levels can break unexpectedly, leading to potential losses.
- Requires constant monitoring and adjustments.
- Subjective interpretation may lead to inconsistent results.
Best Used
- In markets with discernible price levels and consolidation periods.
- Suitable for short to medium-term trading strategies.
Mathematical Probability
The success rate for trades based on support and resistance levels is approximately 65%-75% when combined with other confirmation methods such as candlestick patterns or trendlines.
3. Candlestick Patterns
Explanation
Candlestick patterns visually represent the relationship between open, high, low, and close prices within a specific timeframe. These patterns help traders gauge market sentiment and predict potential price movements.
Examples
- Bullish Engulfing: A small bearish candle followed by a larger bullish candle, indicating a potential upward reversal.
- Bearish Engulfing: A small bullish candle followed by a larger bearish candle, signaling a possible downward reversal.
- Hammer: A candlestick with a small body and a long lower wick, suggesting rejection of lower prices.
- Doji: A candlestick with very small or non-existent body, representing market indecision.
Advantages
- Provides immediate visual signals for trade entry and exit.
- Works effectively alongside other price action tools.
- Enhances the ability to identify reversals and continuations.
Drawbacks
- Patterns can fail, especially in highly volatile markets.
- Requires confirmation from additional price action tools.
- Subjective interpretation may lead to inconsistent trading decisions.
Best Used
- In markets with clear price action and momentum.
- Ideal for short-term trading strategies.
Mathematical Probability
Standalone candlestick patterns have a success rate of around 55%-65%, which can increase to 70%-80% when combined with other confirmation methods.
4. Breakout Trading
Explanation
Breakout trading focuses on entering the market when the price breaks above resistance or below support levels, indicating the potential continuation of the existing trend.
Example
- Bullish Breakout: Price surges above a resistance level, signaling a potential uptrend.
- Bearish Breakout: Price drops below a support level, indicating a possible downtrend.
Advantages
- Offers high reward potential during strong breakout moves.
- Effective in trending markets with clear momentum.
- Provides well-defined entry and exit points.
Drawbacks
- High incidence of false breakouts can lead to losses.
- Requires confirmation from other price action tools to validate the breakout.
- Increased risk if the breakout fails to sustain.
Best Used
- In markets with strong momentum and clear breakout levels.
- Suitable for medium to long-term trading strategies.
Mathematical Probability
The probability of successful breakout trades is approximately 50%-60%, which can rise to 70%-75% when confirmed with additional signals such as volume spikes or trend indicators.
5. Pin Bars
Explanation
Pin bars are candlestick patterns characterized by a small body and a long wick, indicating a rejection of a particular price level and a potential reversal.
Example
- Bullish Pin Bar: Features a long lower wick and a small body near the high, suggesting rejection of lower prices.
- Bearish Pin Bar: Has a long upper wick and a small body near the low, indicating rejection of higher prices.
Advantages
- Provides clear reversal signals.
- Works effectively with support and resistance levels.
- Enhances the ability to identify significant market reversals.
Drawbacks
- Patterns can fail, especially in volatile markets.
- Requires confirmation from other price action tools.
- Subjective interpretation may lead to inconsistent results.
Best Used
- In markets with clear price action and momentum.
- Ideal for short-term trading strategies.
Mathematical Probability
The success rate for pin bar patterns is around 60%-70% when used in conjunction with other confirmation methods such as support/resistance levels or trend indicators.
6. Inside Bars
Explanation
Inside bars are candlestick patterns where the price range is entirely within the range of the preceding candle. This indicates a period of consolidation and potential for a breakout in either direction.
Example
- Bullish Inside Bar: A small bullish candle forms within the range of a larger previous bearish candle, signaling potential upward breakout.
- Bearish Inside Bar: A small bearish candle appears within the range of a larger previous bullish candle, indicating a possible downward breakout.
Advantages
- Provides clear breakout signals.
- Enhances the ability to identify potential volatility spikes.
- Works well with trendlines and support/resistance levels.
Drawbacks
- Patterns can fail in choppy or sideways markets.
- Requires confirmation from additional price action tools.
- Subjective interpretation may lead to inconsistent outcomes.
Best Used
- In markets experiencing consolidation phases.
- Suitable for short to medium-term trading strategies.
Mathematical Probability
The probability of success for inside bar patterns is approximately 55%-65%, increasing to 75%-80% when confirmed with additional signals such as volume increases or trend indicators.
7. Pullbacks and Retracements
Explanation
Pullbacks are temporary reversals in the price movement within an established trend. They offer opportunities to enter a trend at more favorable prices, often aligning with Fibonacci retracement levels.
Example
- In an uptrend, the price pulls back to the 50% Fibonacci retracement level before resuming its upward movement.
- In a downtrend, the price rallies to the 38.2% Fibonacci retracement level before continuing its downward trajectory.
Advantages
- Provides better entry points with reduced risk exposure.
- Often aligns with favorable risk-reward ratios.
- Enhances the potential for higher profitability by entering trends early.
Drawbacks
- Pullbacks can sometimes turn into full trend reversals.
- Requires accurate identification of retracement levels.
- May lead to missed opportunities if misinterpreted.
Best Used
- In well-established trends.
- When combined with tools like Fibonacci retracements or moving averages for confirmation.
Mathematical Probability
Pullbacks and retracements have a success rate of approximately 60%-70% in well-defined trends, especially when combined with Fibonacci levels and other confirmation methods.
8. Range Trading
Explanation
Range trading involves identifying markets that are moving sideways within a defined price range. Traders buy at the lower boundary (support) and sell at the upper boundary (resistance) of the range.
Example
- Buying at the established range support level and selling at the range resistance level, anticipating price oscillation within the range.
Advantages
- Simple strategy suited for low-volatility markets.
- Provides clear profit targets and risk management levels.
- Reduces complexity in trade decision-making.
Drawbacks
- Unsuitable for highly volatile markets where breakouts are frequent.
- Risk of holding positions against sudden breakouts.
- Requires accurate identification of range boundaries.
Best Used
- In markets exhibiting low volatility and clear trading ranges.
- During specific trading hours with reduced market activity, such as lunchtime sessions.
Mathematical Probability
Range trading strategies have a success rate of approximately 65%-75% in calm market conditions, but the probability decreases significantly during high-volatility periods.
9. Order Flow Analysis
Explanation
Order flow analysis examines the real-time flow of buy and sell orders to gain insights into market sentiment and potential price movements. It involves analyzing volume price data, time and sales, and market depth.
Example
- Using Volume Price Analysis (VPA) to identify significant buying or selling pressure that can precede major price movements.
- Monitoring Time and Sales data to detect institutional trading activity that may signal upcoming trends.
Advantages
- Provides real-time market insights and direct supply/demand information.
- Enables tracking of institutional trading activities.
- Enhances the precision of trade entries and exits.
Drawbacks
- Complex interpretation requiring advanced tools and expertise.
- Time-intensive analysis that may not be suitable for all traders.
- Requires access to specialized trading platforms and data.
Best Used
- By day traders and scalpers seeking high-frequency trading opportunities.
- Professional traders requiring detailed market insights for decision-making.
Mathematical Probability
Order flow analysis can achieve a success rate of 70%-80% for experienced traders who effectively utilize the provided data and integrate it with other price action methods.
Hybrid Methods to Improve Probability
Confluence Trading
Confluence trading combines multiple price action techniques to validate trade setups, thereby increasing the probability of success.
- Combination Example: Utilizing candlestick patterns at major support/resistance zones or integrating Fibonacci retracements with trendlines.
- Success Rate: Approximately 70%-80% when correctly implemented.
- Detailed Example:
- Price forms a bullish engulfing candlestick pattern at an ascending trendline aligning with the 61.8% Fibonacci retracement level, providing a high-probability trade setup.
Volume Confirmation
Volume confirmation involves pairing price action analysis with volume indicators to validate the strength of price movements.
- Combination Example: Confirming breakout trades by ensuring increased volume accompanies the breakout.
- Success Rate: Enhances success probability to approximately 75%.
Suggested Method
The most effective approach in price action trading leverages a hybrid method that combines multiple strategies to enhance accuracy and reduce risk. This comprehensive framework typically involves:
- Primary Strategy: Employing chart patterns in conjunction with support and resistance levels to identify high-probability trade setups.
- Secondary Strategy: Using candlestick patterns for confirmation of reversals and continuations.
- Tertiary Strategy: Integrating order flow analysis to validate market sentiment and institutional activities.
- Risk Management: Applying favorable risk-reward ratios (e.g., 1:2 or 1:3) to balance potential risks and rewards.
This combined approach ensures a higher probability of successful trades by requiring multiple confirmations before entry, thus minimizing false signals and optimizing trade outcomes.
Impact of Risk Ratios on Trading Methods
Overview of Risk-Reward Ratios
The risk-reward ratio defines the amount a trader is willing to risk relative to the potential reward for each trade. Commonly used ratios include 1:1, 1:2, and 1:3.
Risk-Reward Ratio Table
| Risk-Reward Ratio | Required Win Rate to Breakeven | Typical Win Rate with Price Action |
|---|---|---|
| 1:1 | 50% | 55%-65% |
| 1:2 | 33% | 50%-60% |
| 1:3 | 25% | 45%-55% |
| 1:4 | 20% | 40%-50% |
| 1:5 | 17% | 35%-45% |
Impact on Trading Methods
| Trading Method | Recommended Risk-Reward Ratio | Impact on Profitability |
|---|---|---|
| Trend Trading | 1:2 or higher | High profitability in strong trends. |
| Support/Resistance Trading | 1:1 or 1:2 | Moderate profitability in ranging markets. |
| Candlestick Patterns | 1:1 or 1:2 | Moderate profitability with quick signals. |
| Breakout Trading | 1:2 or higher | High profitability in strong breakouts. |
| Pin Bars | 1:1 or 1:2 | Moderate profitability with reversal signals. |
| Inside Bars | 1:2 or higher | High profitability in strong breakouts. |
| Range Trading | 1:1 or 1:2 | Steady profitability in stable ranges. |
| Order Flow Analysis | 1:2 or higher | Enhanced profitability with accurate order insights. |
Risk Management Conclusions
- Higher Risk-Reward Ratios (1:3+):
-
Require fewer winning trades to achieve profitability.
-
Best suited for high-probability setups involving major chart patterns and significant support/resistance levels.
-
Suitable for longer-term trades with larger potential rewards.
-
- Lower Risk-Reward Ratios (1:1 - 1:2):
- Demand higher win rates to maintain profitability.
- More appropriate for quicker trades utilizing candlestick patterns and smaller support/resistance levels.
- Better suited for shorter timeframes and scalping strategies.
Conclusion
Price action trading offers a versatile and powerful framework for understanding and navigating financial markets. By mastering a variety of methods such as trend trading, support and resistance levels, candlestick patterns, and breakout strategies, traders can develop a comprehensive approach that enhances their ability to make informed trading decisions.
Employing hybrid strategies, which combine multiple price action techniques, significantly improves trade accuracy and reduces risk. Additionally, integrating effective risk management through optimal risk-reward ratios ensures sustainable profitability over the long term.
Ultimately, the success of price action trading depends on the trader's ability to accurately interpret market signals, maintain disciplined risk management, and adapt strategies to changing market conditions.
References
- An Introduction to Price Action Trading Strategies - Investopedia
- Price Action Or Indicators: Which is better (I Traded Both) - Dapo Willis
- Price Action Trading Strategies | TrendSpider Learning Center
- Price Action Trading Strategies That You Need to Know - Earn2Trade
- Price Action Trading: Meaning, Strategies, Patterns, & Risks - Smallcase
- Price Action Trading: Meaning, Benefits & Strategies | 5paisa
- Price Action Trading - What Is It, Examples, Benefits - WallStreetMojo
Last updated January 22, 2025