
Unlock Seamless DLL Debugging: Your Step-by-Step Visual Studio Guide for C# Projects
Dive deep into your external DLLs with full source code access in Visual Studio. Master the setup, debug like a pro, and squash those elusive bugs!
Debugging C# projects that rely on external Dynamic Link Libraries (DLLs) can sometimes feel like navigating a maze, especially when you need to step into the DLL's code. Fortunately, when you have the DLL's project files, Visual Studio offers a powerful and integrated debugging experience. This guide will walk you through the precise steps to configure your environment, enabling you to seamlessly debug both your main application and the external DLL, inspect variables, and trace execution flow with full source code visibility.
Essential Insights: Key Takeaways
- Integrated Solution Approach: The most effective method involves adding the DLL's project directly into your main application's Visual Studio solution.
- Project References are Crucial: Referencing the DLL project (not just the compiled .dll file) allows Visual Studio to manage builds and debugging symbols (PDBs) automatically.
- Debug Configuration is Key: Ensure both your main project and the DLL project are set to a "Debug" configuration to generate the necessary debugging information for a rich debugging experience.
Prerequisites: Setting Up Your Visual Studio Environment
Before diving into the debugging process, a foundational setup is necessary to ensure Visual Studio can effectively link your main C# project with the external DLL's source code. This involves organizing your projects within a single solution and establishing the correct relationships between them.
Step 1: Integrate the DLL Project into Your Solution
The cornerstone of debugging an external DLL with its source code is to have both the calling application's project and the DLL's project within the same Visual Studio solution. This allows Visual Studio to understand the dependencies and manage the build and debug processes cohesively.
Adding the DLL Project
If your DLL project isn't already part of your main application's solution, you need to add it:
- Open your main C# project's solution in Visual Studio.
- In the Solution Explorer, right-click on the Solution node (the very top item, e.g., "Solution 'MyApplication'").
- Select Add > Existing Project...
- Navigate to the directory containing the DLL's project file (e.g.,
MyLibrary.csproj) and select it. Click Open.
The DLL project will now appear in your Solution Explorer alongside your main application project.
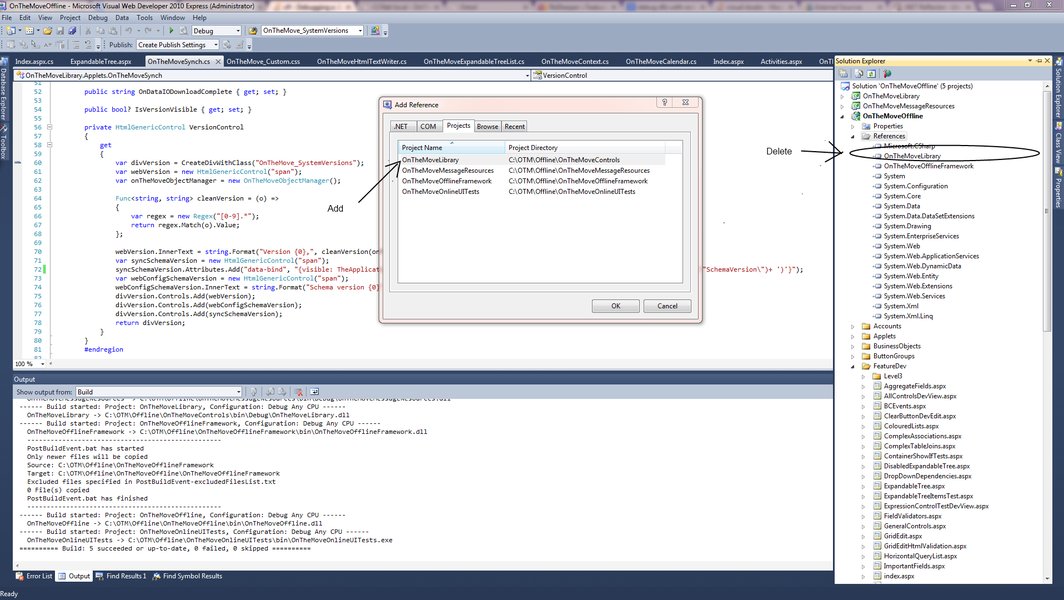
Visual Studio Solution Explorer illustrating how projects are listed. Adding a project reference is done via the Dependencies/References node.
Establishing a Project Reference
Once the DLL project is in your solution, your main application needs to reference this project, not a pre-compiled DLL file. This tells Visual Studio to build the DLL from source as part of your solution and to use its symbols for debugging.
- In Solution Explorer, expand your main C# project.
- Right-click on the Dependencies node (or References in older Visual Studio versions).
- Select Add Project Reference....
- In the Reference Manager dialog, go to the Projects tab on the left.
- Check the box next to the DLL project you added in the previous step.
- Click OK.
If your main project previously referenced a compiled version of the DLL (a file reference), you should remove that binary reference to avoid conflicts.
Step 2: Configure Build and Debug Settings
With the projects correctly structured in your solution, the next step is to configure the build and debug settings. This ensures that debugging symbols are generated and that Visual Studio launches the correct project when you start a debugging session.
Ensuring Debug Configuration for the DLL
For Visual Studio to allow stepping through the DLL's source code and inspecting its variables, the DLL project must be built in a "Debug" configuration. This configuration generates Program Database (.pdb) files, which contain the debugging symbols.
- In Solution Explorer, right-click on the DLL project and select Properties.
- Go to the Build tab (or Compile tab in some project types).
- From the Configuration dropdown at the top, select Debug. (If you have multiple configurations like "Active (Debug)", ensure "Debug" is selected).
- Scroll down to the advanced build settings (often a button labeled "Advanced..." or settings directly visible). Ensure that Debugging information (or similar wording) is set to Full, PDB-only, or Portable. "Full" is typically recommended for local debugging.
- Save any changes.
Repeat similar checks for your main application project to ensure it's also in a "Debug" configuration.
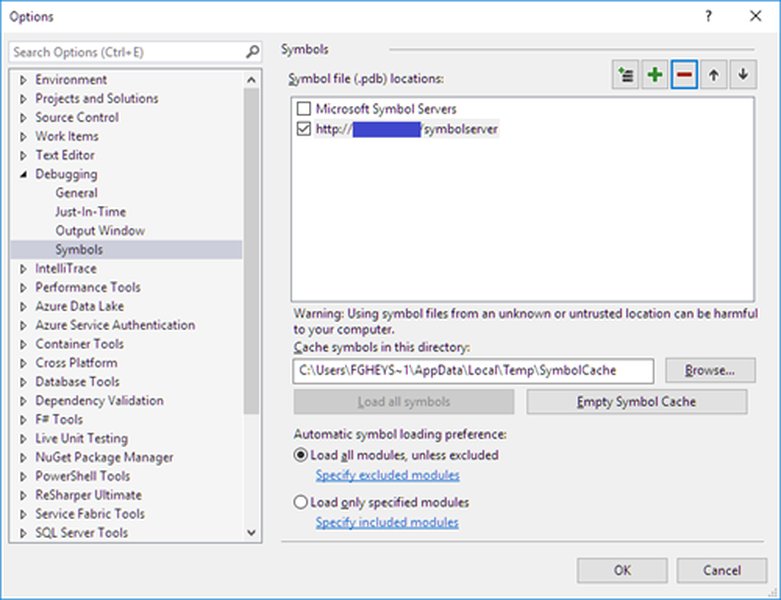
Conceptual illustration of symbol settings. Ensure .pdb files are generated for effective debugging.
Setting the Startup Project
You need to tell Visual Studio which project to launch when you start debugging. This is typically your main executable application.
- In Solution Explorer, right-click on your main C# project (the one that calls the DLL).
- Select Set as Startup Project. The project name will become bold.
Verifying Project Dependencies and Build Order
Visual Studio usually handles this automatically with project references, but it's good practice to verify that the DLL project is set to build before your main application project.
- Right-click on the Solution in Solution Explorer and select Project Build Order... or Project Dependencies....
- Ensure your main project depends on the DLL project. If you select your main project from the "Projects" dropdown, the DLL project should be checked in the "Depends on" list.
- This ensures that if you make changes to the DLL, it's recompiled before the main application is built and run.
After these configurations, build your entire solution (Ctrl+Shift+B or Build > Build Solution) to ensure everything compiles correctly and the necessary DLL and PDB files are placed in the output directory of your main application (typically bin/Debug).
Step 3: Initiating the Debugging Session
With the setup and configuration complete, you are ready to start debugging and step into your external DLL's code.
Setting Breakpoints in the DLL
Breakpoints are markers that tell the debugger to pause execution at a specific line of code. You can set breakpoints in both your main application's code and, crucially, within the source code files (e.g., .cs files) of your DLL project.
- Open a source code file from your DLL project.
- Click in the left margin next to a line of code where you want the debugger to pause. A red circle will appear, indicating a breakpoint.
Launching the Debugger
Start the debugging session for your main application:
- Press F5.
- Or, go to the Debug menu and select Start Debugging.
Visual Studio will build the projects (if changed) and launch your startup project with the debugger attached.
Navigating Code During Debugging
When your application's execution reaches a point where it calls a method in your DLL that contains a breakpoint, or if you choose to step into a method call that resides in the DLL, execution will pause at that breakpoint within the DLL's source code. You can now:
- Step Into (F11): If the current line is a call to a method (in your main app or the DLL), F11 will take you into that method's source code. This is how you enter the DLL code.
- Step Over (F10): Executes the current line of code. If it's a method call, it executes the entire method and moves to the next line in the current scope, without showing you the internals of the called method.
- Step Out (Shift+F11): If you are inside a method, Shift+F11 will execute the rest of that method and return to the line of code that called it.
While paused, you can use Visual Studio's debugging windows (Locals, Watch, Call Stack, etc.) to inspect variable values, examine the program state, and understand the execution flow within the DLL.
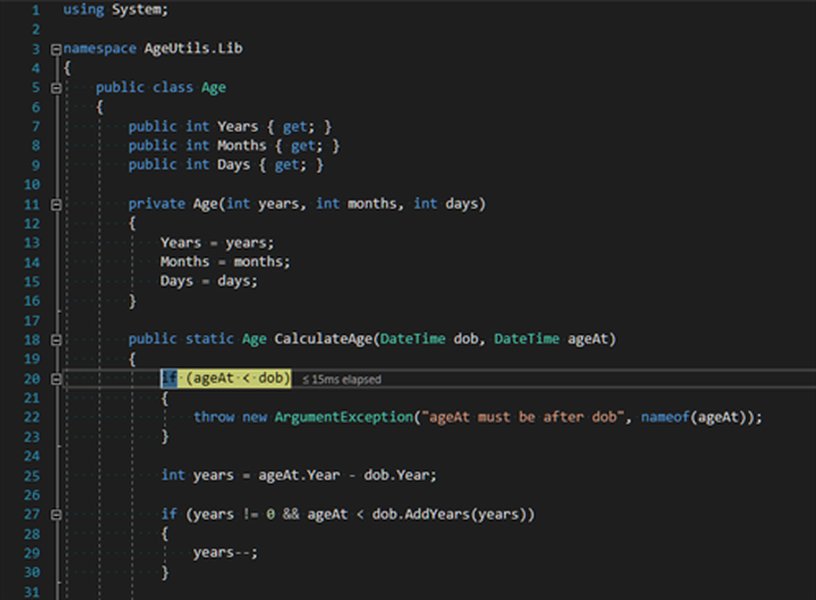
Conceptual representation of the "Step Into" debugging action, allowing traversal into external code.
Verifying Symbols Are Loaded
To confirm that Visual Studio is using the debugging symbols for your DLL:
- While debugging and paused, go to Debug > Windows > Modules.
- In the Modules window, find your DLL in the list. Check the "Symbol Status" column. It should say "Symbols loaded." If it says "Symbols not loaded" or "Cannot find or open the PDB file," there's an issue with your PDB file generation or location.
In Visual Studio 2022 and later, the External Sources node in Solution Explorer can also be helpful during debugging to browse and debug external sources, especially for NuGet packages or libraries with Source Link support.
Visualizing the Debugging Workflow
The process of setting up and debugging an external DLL with project files in Visual Studio involves several interconnected steps. This mindmap provides a visual overview of the entire workflow, from initial solution setup to the active debugging phase.
This mindmap illustrates the logical flow: you begin by structuring your solution, then configure project references and build settings, and finally proceed with the interactive debugging steps, leveraging Visual Studio's tools for verification and analysis.
Key Debugging Aspects Comparison
When debugging external DLLs with project files, various factors contribute to the overall effectiveness and ease of the process. The radar chart below provides an opinionated comparison of these aspects when following the recommended setup (integrating the DLL project into your solution and using project references). The scale is 1 (Less Favorable/More Complex) to 5 (Highly Favorable/Very Simple).
As the chart suggests, having the DLL project files and integrating them correctly offers a highly streamlined and powerful debugging experience, especially regarding symbol management, source code access, and stepping control.
Troubleshooting Common Debugging Hurdles
Even with the correct setup, you might encounter some common issues. Here’s how to address them:
Symbols Not Loading (.pdb issues)
- Symptom: Breakpoints in the DLL are not hit, or they show as unfilled circles with a warning ("The breakpoint will not currently be hit. No symbols have been loaded for this document."). The Modules window shows "Symbols not loaded" for your DLL.
- Solution:
- Ensure the DLL project is set to "Debug" configuration and that PDB files are being generated (check project properties > Build > Advanced).
- Clean and rebuild the entire solution.
- Verify that the
.pdbfile for your DLL is present in the same directory as the.dllfile in your main application's output folder (e.g.,bin/Debug). - In Visual Studio, go to Tools > Options > Debugging > Symbols. Ensure "Microsoft Symbol Servers" is checked if you're debugging .NET framework code, and verify that your output directory is not excluded. You can also manually add symbol file locations here.
Build Configuration Mismatches
- Symptom: Issues with loading the DLL, or unexpected behavior. This can happen if your main project and DLL project target different platforms (e.g., x86 vs. x64) or .NET Framework versions in incompatible ways.
- Solution:
- Use the Configuration Manager (Build > Configuration Manager) to ensure both your main project and the DLL project are targeting compatible platforms (e.g., "Any CPU", or both "x64", or both "x86") and configurations ("Debug").
Incorrect Project References
- Symptom: Old version of the DLL is being used, or changes in DLL source code are not reflected.
- Solution:
- Double-check that your main project references the DLL project and not a specific
.dllfile from an arbitrary location. Remove any file references to the DLL if a project reference exists. - Ensure "Copy Local" is set to "True" for the project reference (usually default and correct), meaning the built DLL from the project is copied to the main app's output directory.
- Double-check that your main project references the DLL project and not a specific
Alternative: Attaching to a Running Process
In some scenarios, your DLL might be loaded by an application that you don't start directly from Visual Studio (e.g., a Windows Service, a web application hosted in IIS, or another third-party executable). In such cases, you can still debug your DLL's source code by attaching the Visual Studio debugger to the running process:
- Ensure your DLL project has been built in "Debug" configuration and the
.dlland.pdbfiles are deployed to the location where the external application will load them. - Open your DLL project (or the solution containing it) in Visual Studio.
- Set breakpoints in your DLL's source code.
- Run the external application that loads your DLL.
- In Visual Studio, go to Debug > Attach to Process... (or Ctrl+Alt+P).
- In the "Attach to Process" dialog:
- Find and select the process that is hosting your DLL from the "Available Processes" list.
- Ensure the "Attach to:" field correctly specifies the type of code you want to debug (e.g., "Managed (.NET Core, .NET 5+)" or "Managed (v4.x)" for .NET Framework). You can click "Select..." to change this if needed.
- Click Attach.
Once attached, if the application executes the code in your DLL where breakpoints are set, the debugger will pause, allowing you to step through your DLL's source code.
Essential Debugging Tools in Visual Studio
Visual Studio offers a rich set of tools to aid in debugging. When debugging your C# project and the external DLL, these windows become invaluable for understanding program state and flow. The table below outlines some of the most commonly used debugging tools:
| Tool/Window Name | Primary Purpose & Relevance to DLL Debugging |
|---|---|
| Breakpoints Window | Manages all breakpoints in your solution. Allows enabling/disabling, setting conditions, and actions for breakpoints in both main project and DLL code. |
| Call Stack Window | Shows the chain of method calls that led to the current execution point. Crucial for understanding how your DLL's methods were invoked from the main project or other parts of the DLL. |
| Locals Window | Displays variables within the current scope of the executing method (whether in the main project or the DLL). Allows inspection of their values. |
| Watch Window (Watch 1-4) | Allows you to specify variables or expressions (from any loaded assembly, including your DLL) whose values you want to monitor continuously as you step through code. |
| Immediate Window | Allows you to execute expressions, statements, or call methods at runtime during a debug break. Useful for testing DLL functions or inspecting object states without modifying code. |
| Modules Window | Lists all DLLs and executables loaded by the process. Critically, it shows whether symbols (.pdb files) have been loaded for each module, which is essential for debugging your external DLL's source. |
| Output Window | Displays various messages, including debug output (from Debug.WriteLine), module load/unload information, and exception messages. Can provide clues if the DLL fails to load. |
| Exception Settings Window | Configures how the debugger handles exceptions. You can set it to break when specific exceptions are thrown, even if they are handled, which is useful for diagnosing issues within the DLL. |
Familiarizing yourself with these tools will significantly enhance your ability to diagnose and resolve issues when debugging complex applications involving external DLLs.
Video Guide: Debugging External Sources
For a visual demonstration and further insights into debugging external code, including libraries and DLLs, within Visual Studio, the following video provides a helpful overview. While it covers a broad topic, the principles are directly applicable to debugging your C# DLL when you have the project files.
This video, "Debugging External Sources with Visual Studio," demonstrates techniques for stepping into and debugging code that isn't part of your immediate project, a scenario similar to working with an integrated DLL project.
The video discusses how Visual Studio handles external sources, the importance of symbols (PDB files), and navigating through code that resides outside your main project. These concepts are fundamental to successfully debugging your external DLLs when their project files are integrated into your solution.
Frequently Asked Questions (FAQ)
Recommended Further Exploration
To deepen your understanding of debugging in Visual Studio and related concepts, consider exploring these queries:
- What are some advanced debugging techniques in Visual Studio for C# applications?
- How can I use conditional breakpoints and tracepoints in Visual Studio to diagnose complex issues?
- What is the detailed role of symbol files (PDBs) in the .NET debugging process?
- What are best practices for debugging multi-threaded C# applications in Visual Studio?
References
This guide was synthesized using information from various authoritative sources, including:
Last updated May 14, 2025