
Unlocking the Power of Research: The Art and Science of Data Analysis and Interpretation
Discover how researchers transform raw information into meaningful insights through systematic analysis and thoughtful interpretation
Key Insights About Data Analysis and Interpretation
- Data analysis is the systematic examination of data using statistical and logical techniques to discover patterns and relationships, while interpretation assigns meaning to these findings.
- Effective interpretation connects analysis results to research questions, existing literature, and practical implications, transforming numbers into actionable knowledge.
- The value of research lies not just in collecting data but in the rigorous analysis and insightful interpretation that leads to valid, reliable conclusions.
Defining Data Analysis in Research
Data analysis in research refers to the systematic process of examining, cleaning, transforming, and modeling collected data to discover useful information, identify patterns and relationships, and support decision-making. It's the bridge between raw data and meaningful insights, using various statistical and logical techniques to extract significance from information gathered during the research process.
The Data Analysis Process
The process of data analysis typically follows several key stages that transform raw data into interpretable findings:
Data Preparation
Before analysis can begin, researchers must prepare their data by:
- Collecting relevant data through surveys, experiments, observations, or existing datasets
- Cleaning the data to address errors, inconsistencies, and missing values
- Organizing and structuring the data in a format suitable for analysis
- Coding qualitative data to enable systematic examination
Data Examination
Once prepared, researchers examine the data using various analytical techniques:
- Descriptive Analysis: Summarizing data with measures like mean, median, mode, and standard deviation
- Exploratory Analysis: Identifying patterns, trends, and relationships within the data
- Inferential Analysis: Drawing conclusions about populations based on sample data
- Predictive Analysis: Using data patterns to predict future outcomes or trends
Data Visualization
Researchers often use visual representations to better understand and communicate data patterns:
- Charts, graphs, and diagrams to illustrate relationships and trends
- Interactive dashboards to explore data from multiple perspectives
- Visual mapping to represent complex relationships between variables
Qualitative vs. Quantitative Data Analysis
Research data analysis approaches vary significantly depending on whether the data is qualitative or quantitative in nature:
| Aspect | Quantitative Analysis | Qualitative Analysis |
|---|---|---|
| Data Type | Numerical data (measurements, counts) | Non-numerical data (text, images, observations) |
| Primary Methods | Statistical techniques (regression, ANOVA, correlation) | Thematic analysis, content analysis, grounded theory |
| Software Tools | SPSS, R, SAS, Excel | NVivo, ATLAS.ti, MAXQDA |
| Analysis Focus | Testing hypotheses, identifying relationships | Identifying themes, patterns, and meanings |
| Outcome Presentation | Tables, statistical results, charts | Themes, categories, narratives, quotations |
Understanding Data Interpretation in Research
Data interpretation is the process of assigning meaning to the analyzed data and explaining its significance in the context of the research questions or hypotheses. It goes beyond simply describing what the data shows to explaining why these findings matter and how they contribute to existing knowledge.
Key Elements of Data Interpretation
Effective data interpretation involves several critical components:
Making Sense of Patterns
Researchers must examine the patterns identified during analysis and determine what they reveal about the phenomenon being studied. This involves:
- Identifying significant trends, correlations, or differences in the data
- Assessing whether the results support or contradict the research hypotheses
- Distinguishing between meaningful patterns and random variations
Contextualizing Findings
Interpretation requires placing findings within the broader context of:
- Existing literature and theoretical frameworks in the field
- Previous research findings on the same or related topics
- The specific conditions and limitations of the current study
- Real-world applications and implications
Drawing Conclusions
Based on the interpretation, researchers draw conclusions that:
- Address the original research questions or objectives
- Articulate the significance and implications of the findings
- Acknowledge limitations and suggest directions for future research
- Provide recommendations based on the evidence
The Relationship Between Analysis and Interpretation
While data analysis and interpretation are distinct processes, they are deeply interconnected and interdependent. Analysis provides the foundation for interpretation, while interpretation gives meaning and relevance to the analysis. This relationship can be visualized as follows:
The mindmap above illustrates how data analysis and interpretation fit within the broader research process, highlighting their interconnected nature and the various components involved in each stage.
Comparing Key Aspects of Data Analysis and Interpretation
While data analysis and interpretation are complementary processes, they differ in several important ways. The following radar chart compares these processes across multiple dimensions:
This chart illustrates how data analysis tends to be more technically complex and software-dependent, requiring greater statistical knowledge. In contrast, data interpretation involves more creativity, theoretical knowledge, and subjectivity, with a stronger direct connection to research questions.
Best Practices for Effective Data Analysis and Interpretation
For Data Analysis
- Choose appropriate methods: Select analysis techniques that align with your research questions, data type, and study design
- Ensure data quality: Thoroughly clean and validate data before analysis to minimize errors
- Document procedures: Maintain detailed records of all analytical steps to ensure transparency and reproducibility
- Use appropriate software: Select tools that can handle your data and provide the necessary analytical capabilities
- Validate results: Cross-check findings using multiple methods when possible
For Data Interpretation
- Connect to research questions: Always tie interpretations back to your original research objectives
- Consider alternative explanations: Explore multiple possible interpretations of your findings
- Acknowledge limitations: Be transparent about factors that might affect the validity or generalizability of your conclusions
- Contextualize in literature: Relate your findings to existing research and theoretical frameworks
- Avoid overinterpretation: Make claims that are supported by your data, not beyond what your evidence supports
Visual Guide to Data Analysis and Interpretation
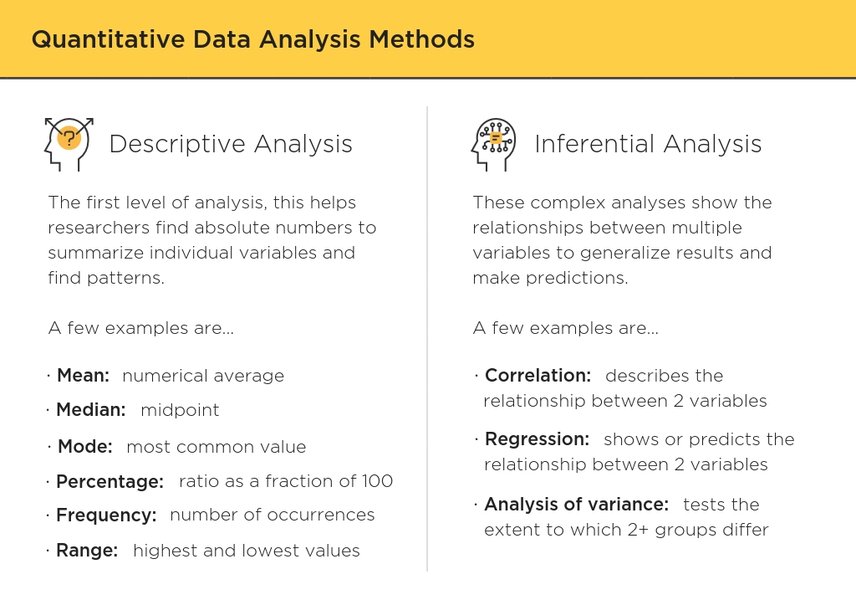
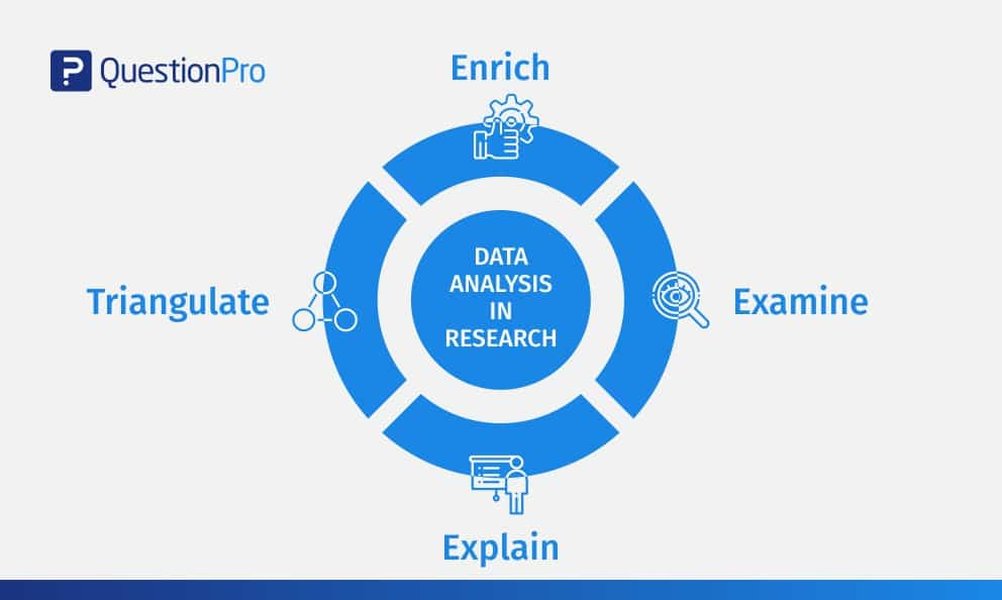
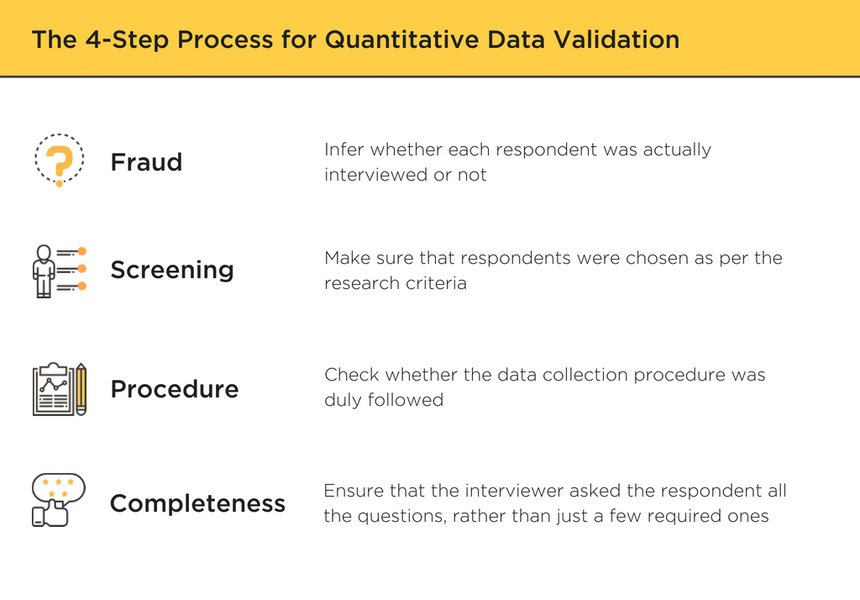
These visual representations illustrate the various methods, processes, and relationships involved in data analysis and interpretation. The first image shows common quantitative analysis methods, the second depicts the overall research analysis flow, and the third presents a four-step process for moving from data to insights.
Practical Applications of Data Analysis and Interpretation
This video provides practical guidance on how to interpret results in research and thesis writing. It offers valuable insights into the process of analyzing data and drawing meaningful conclusions from research findings. The presenter walks through different approaches to interpretation and explains how to connect results to research questions and theoretical frameworks.
Frequently Asked Questions
References
- An Overview of Data Analysis and Interpretations in Research - ResearchGate
- Data Analysis and Interpretation - iEduNote
- Data Analysis in Research: Types & Methods - QuestionPro
- What Is Data Analysis? Types, Methods, & Tools for Research - Couchbase
- Data Analysis - Process, Methods and Types - Research Method
-
Interpretation and display of research results - PMC
- Understanding the Interpretation of Results in Research - Mind the Graph
Recommended Searches
Last updated April 7, 2025