
Comprehensive Guide to Debugging Android Chrome Websites
Mastering Remote Debugging for Optimal Mobile Web Performance
Key Takeaways
- Enable USB Debugging: Activate Developer Options and USB debugging on your Android device to facilitate remote connections.
- Use Chrome DevTools: Leverage Chrome's powerful DevTools for real-time inspection and debugging of mobile websites.
- Troubleshoot Effectively: Implement best practices and troubleshooting tips to ensure a seamless debugging experience.
Introduction to Debugging Android Chrome Websites
Debugging websites on Android Chrome is essential for web developers aiming to ensure their websites function seamlessly on mobile devices. With the increasing dominance of mobile internet usage, optimizing user experience on smartphones is paramount. This comprehensive guide delves into the methodologies, tools, and best practices for effectively debugging websites on Android Chrome using Chrome DevTools.
Prerequisites for Remote Debugging
Hardware and Software Requirements
Before initiating the debugging process, ensure you have the following:
- Desktop Computer: A computer running Windows, macOS, or Linux with the latest version of Google Chrome installed.
- Android Device: An Android smartphone or tablet with Chrome browser installed, running Android 4.0 or higher.
- USB Cable: A reliable USB cable to connect your Android device to the computer.
- USB Drivers: Appropriate USB drivers installed on your computer to facilitate device recognition (especially for Windows users).
Step-by-Step Guide to Setting Up Remote Debugging
1. Enable Developer Options on Your Android Device
Developer Options provide access to various settings crucial for debugging. Here's how to enable them:
- Access Settings: Open the Settings app on your Android device.
- Navigate to About Phone: Scroll down and tap on About Phone.
- Enable Developer Mode: Locate the Build Number and tap it seven times consecutively. You will receive a notification indicating that Developer Options have been enabled.
2. Activate USB Debugging
USB Debugging allows your Android device to communicate with Chrome DevTools on your computer:
- Return to Settings: Go back to the main Settings menu.
- Access Developer Options: Tap on Developer Options, which is now visible after enabling Developer Mode.
- Enable USB Debugging: Scroll down and toggle the USB Debugging option to "On". Confirm any prompts that appear.
3. Connect Your Android Device to the Computer
Establish a physical connection between your Android device and your computer:
- Use USB Cable: Connect your Android device to the computer using the USB cable.
- Select Connection Mode: On your device, you may need to select the appropriate connection type (e.g., File Transfer (MTP) or PTP) to facilitate USB debugging.
- Authorize Debugging: When prompted on your device, select Always allow from this computer to prevent recurring authorization requests.
4. Configure Chrome DevTools on Your Computer
Prepare Chrome on your computer to recognize and interface with your Android device:
- Open Chrome: Launch Google Chrome on your desktop.
- Access DevTools: In the address bar, enter
chrome://inspect#devicesand press Enter. - Enable USB Device Discovery: Ensure the Discover USB devices checkbox is checked. This allows Chrome to detect connected Android devices.
- Verify Device Connection: Your Android device should appear under the Remote Target section. If not, ensure USB debugging is enabled and retry the connection.
5. Inspect and Debug the Website
With the setup complete, you can now begin debugging your website:
- Open Website on Android Chrome: On your Android device, launch Chrome and navigate to the website you wish to debug.
- Identify the Target: In the
chrome://inspectinterface on your computer, locate the specific tab or WebView corresponding to your website. - Initiate Inspection: Click the Inspect link next to the website's URL. This action will open a new instance of Chrome DevTools tailored to the mobile context.
6. Utilize Chrome DevTools Features
DevTools offers a plethora of features to aid in debugging:
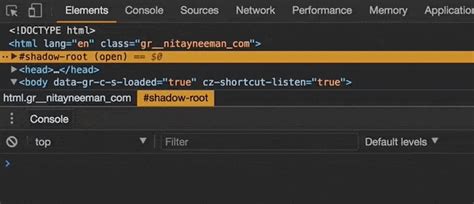
- Elements Panel: Inspect and modify the DOM and CSS in real time. You can adjust styles, view computed properties, and identify layout issues.
- Console Panel: Monitor and log JavaScript errors, execute scripts, and interact with the page programmatically.
- Network Panel: Analyze network requests, monitor loading times, and identify bottlenecks affecting performance.
- Performance Panel: Record and assess the website's performance metrics to pinpoint slow-rendering components.
- Application Panel: Manage and inspect web storage, service workers, and other application-related assets.
7. Advanced Debugging Techniques
Beyond basic inspection, DevTools offers advanced functionalities to enhance debugging:
- Responsive Design Mode: Simulate various screen sizes and resolutions to ensure the website's responsiveness across devices.
- Device Emulation: Mimic touch gestures, device orientations, and even emulate specific device capabilities.
- Throttling Network Conditions: Test website performance under different network speeds, such as 3G or offline scenarios.
- JavaScript Debugging: Set breakpoints, step through code, and inspect variable states to debug complex scripts.
Best Practices for Effective Debugging
Maintain Updated Software
Ensure that both your Android device's Chrome browser and your desktop Chrome are updated to the latest versions. Updates often include critical bug fixes and performance improvements that can aid in debugging.
Use Stable Connections
A stable USB connection is crucial for uninterrupted debugging sessions. Consider using high-quality cables and avoid using USB hubs that might introduce connectivity issues.
Leverage Emulators and Online Tools
While physical devices offer the most accurate debugging environment, emulators like Android Studio's emulator or online services such as BrowserStack can be invaluable for testing across a variety of devices and configurations without needing multiple physical devices.
Implement Source Maps
When working with minified or transpiled JavaScript and CSS, source maps can help map the transformed code back to the original source, making debugging more intuitive and efficient.
Practice Incremental Debugging
Debugging in small, manageable sections can help isolate issues more effectively. Start by testing individual components or features before progressing to more complex integrations.
Troubleshooting Common Issues
Device Not Recognized
If your Android device doesn't appear in Chrome DevTools:
- Check USB Connection: Ensure the USB cable is properly connected and functional.
- Verify USB Debugging: Confirm that USB Debugging is enabled in Developer Options.
- Install Necessary Drivers: For Windows users, install appropriate USB drivers specific to your device model.
- Restart Devices: Sometimes, simply restarting both the Android device and the computer can resolve recognition issues.
Device Shows as "Offline"
If your device is listed but marked as "Offline":
- Reauthorize Connection: Disconnect and reconnect the USB cable, and confirm the debugging authorization prompt on your device.
- Update Chrome: Ensure both the desktop and mobile Chrome browsers are updated to the latest versions.
- Check Developer Options: Verify that Developer Options and USB Debugging remain enabled after reconnecting.
Delayed or Unresponsive DevTools
If Chrome DevTools is slow or not responding:
- Close Unnecessary Tabs: Reduce the number of open tabs and extensions in Chrome to free up resources.
- Optimize Performance: Use performance profiling tools to identify and address resource-intensive scripts or processes.
- Restart DevTools: Close and reopen DevTools to reset the debugging session.
Advanced Tools and Techniques
Using Remote Debugging Over Wi-Fi
For scenarios where a USB connection is impractical, you can set up remote debugging over a Wi-Fi network:
- Connect Both Devices to the Same Network: Ensure that your Android device and computer are connected to the same Wi-Fi network.
- Enable Wireless Debugging: In Developer Options, enable Wireless Debugging.
- Pair Devices: Use the pairing code provided in
chrome://inspectto establish a connection. - Initiate Debugging: Once paired, your device should appear under Remote Target, allowing inspection and debugging.
This method offers greater flexibility and can be particularly useful for testing on larger screens or in collaborative environments.
Automating Debugging Tasks
Utilize automation tools and scripts to streamline repetitive debugging tasks:
- Selenium: Automate browser interactions and testing workflows to identify issues systematically.
- Grunt/Gulp: Integrate debugging processes into build tasks to ensure consistency across development cycles.
- Continuous Integration (CI): Incorporate automated testing and debugging into CI pipelines for real-time issue detection.
Integrating Logging Frameworks
Implement advanced logging frameworks to capture detailed logs and metrics:
- Logcat: Use Android's Logcat to monitor system and application logs in real time.
- Advanced Logging Libraries: Incorporate libraries like Timber or SLF4J to manage and categorize logs efficiently.
- Remote Logging Services: Utilize services such as Loggly or Splunk to aggregate and analyze logs from multiple devices.
Enhancing Debugging Efficiency
Customizing Chrome DevTools
Tailor DevTools to fit your workflow and preferences:
- Theming: Adjust the color scheme of DevTools for better visibility and reduced eye strain.
- Shortcuts: Learn and utilize keyboard shortcuts to navigate DevTools faster.
- Extensions: Install Chrome extensions that augment DevTools functionalities, such as React DevTools or Vue.js DevTools.
Collaborative Debugging
Engage in collaborative debugging sessions to leverage collective expertise:
- Screen Sharing: Use screen-sharing tools like Zoom or Google Meet to collaborate with team members in real-time.
- Pair Programming: Work alongside another developer to identify and resolve issues more efficiently.
- Documentation: Maintain detailed documentation and logs to track debugging progress and solutions.
Continuous Learning and Adaptation
Stay updated with the latest debugging techniques and tools:
-
Online Courses: Enroll in courses focused on mobile web development and debugging.
-
Community Engagement: Participate in developer forums, attend webinars, and contribute to open-source projects.
-
Stay Informed: Regularly review official documentation and follow industry blogs to keep abreast of new features and best practices.
Conclusion
Effective debugging of Android Chrome websites is a multifaceted process that involves setting up the right tools, following systematic steps, and adopting best practices. By enabling USB debugging, leveraging Chrome DevTools, and utilizing advanced techniques, developers can ensure their websites perform optimally on mobile devices. Continuous learning and adaptation to new tools and methodologies further enhance the debugging process, leading to robust and user-friendly mobile web experiences.
References
Last updated January 12, 2025