
Enhancing Stored Procedure Debugging with Generic Parameters in SQL Server
Strategies and Best Practices for Implementing Debug Parameters in T-SQL
Debugging stored procedures in SQL Server is a crucial part of database development and maintenance. While tools like SQL Server Management Studio (SSMS) and SQL Server Data Tools (SSDT) offer robust debugging capabilities, incorporating generic debug parameters directly into your stored procedures can provide a flexible and often more accessible way to troubleshoot logic and performance issues, especially in environments where traditional debugging tools are limited or cumbersome. This approach allows you to control the behavior of your stored procedure during execution, providing valuable insights into its internal workings without altering the core logic.
Key Debugging Parameter Highlights
- Conditional Output: Utilize a debug parameter to control the output of diagnostic information, such as variable values or execution messages, only when debugging is enabled.
- Dynamic SQL Inspection: When using dynamic SQL within a stored procedure, a debug parameter can be used to print the generated SQL statement before execution, allowing for easy inspection and identification of issues.
- "What If" Scenarios: Implement a debug mode that simulates the execution of data modification language (DML) statements (INSERT, UPDATE, DELETE) without actually committing the changes, providing a safe way to test the impact of the procedure.
The Value of Integrated Debugging Parameters
Integrating debug parameters into your SQL Server stored procedures offers several advantages. It allows for a more controlled and less intrusive debugging experience, particularly in production or shared environments where using a step-by-step debugger might be challenging or disruptive. By adding a simple parameter, you can enable verbose logging, inspect intermediate results, and even simulate execution without permanent data changes. This proactive approach to debugging, building diagnostic capabilities directly into the code, can significantly reduce the time and effort required to identify and resolve issues.
Why Embed Debugging?
While SQL Server provides external debugging tools, there are scenarios where embedding debugging logic becomes invaluable. These include:
Limited Debugger Access
In some production environments, security policies or infrastructure limitations might restrict direct access to interactive debuggers like those in SSMS or SSDT. Debug parameters offer an alternative way to gain visibility into stored procedure execution.
Troubleshooting Production Issues
When a stored procedure misbehaves in a production environment, you often need to diagnose the issue with minimal impact. Enabling a debug parameter allows you to capture diagnostic information specific to the production execution without halting processes or requiring extensive setup.
Analyzing Dynamic SQL
Stored procedures utilizing dynamic SQL can be particularly challenging to debug. A debug parameter can print the generated SQL string, allowing you to verify its correctness before execution. This is often more effective than trying to reconstruct the dynamic SQL from variable values during a traditional debugging session.
Complex Logic Flow
For stored procedures with intricate conditional logic or loops, stepping through the code line by line can be time-consuming. Debug parameters can be used to output messages at key points in the execution flow, helping you understand the path taken by the procedure.
Implementing a Generic Debug Parameter
The most common and flexible approach is to introduce an input parameter, typically an integer, to control the level or type of debugging information generated by the stored procedure. A widely adopted convention is to use a parameter named @Debug.
Here's a basic example of how you might incorporate a @Debug parameter:
CREATE PROCEDURE dbo.YourStoredProcedure
  @SomeInputParameter INT,
  @Debug INT = 0 -- 0 for off, 1 for verbose output, 2 for what-if
AS
BEGIN
  -- Your stored procedure logic here

  IF @Debug >= 1
  BEGIN
    -- Output diagnostic information
    PRINT 'Debug: @SomeInputParameter value is ' + CAST(@SomeInputParameter AS VARCHAR(10));
    -- You can add more PRINT or SELECT statements here
  END;

  IF @Debug = 2
  BEGIN
    -- Simulate DML operations without committing
    BEGIN TRAN;
    -- Your INSERT, UPDATE, DELETE statements here
    ROLLBACK TRAN;
    IF @Debug >= 1
    BEGIN
      PRINT 'Debug: Simulated DML execution (rolled back).';
    END;
  END
  ELSE
  BEGIN
    -- Execute actual DML operations
    -- Your INSERT, UPDATE, DELETE statements here
  END;

END;
Parameter Naming and Data Type
Using the name @Debug is a widely recognized convention, making the purpose of the parameter immediately clear. An INT data type provides flexibility to define different levels of debugging:
-
0 (Default): Debugging is off. The stored procedure executes normally with no extra output or simulated actions.
-
1: Enables verbose output. This could include printing parameter values, intermediate variable states, or markers indicating which sections of code are being executed.
-
2: Enables a "what-if" or simulation mode. This is particularly useful for stored procedures that perform data modifications. In this mode, DML statements are typically wrapped in a transaction that is always rolled back.
-
Higher values: You can define additional levels for more granular debugging, although keeping it simple with 0, 1, and 2 is often sufficient.
Conditional Logic for Debugging Output
Within the stored procedure, use IF @Debug >= 1 or similar conditions to control the execution of debugging-specific code. This ensures that the debugging logic is only active when explicitly requested.
Using PRINT and RAISERROR
PRINT statements are useful for outputting simple messages or variable values to the Messages tab in SSMS. RAISERROR can also be used for debugging, particularly when you want to output messages with specific severity levels or states. While primarily used for error handling, RAISERROR with a low severity level (0 to 10) can serve as a debugging tool. RAISERROR might be preferred over PRINT in some cases, although it has a maximum message length limit.
Consider this example using RAISERROR for debugging:
IF @Debug >= 1
BEGIN
  RAISERROR('Debug: Processing data for ID: %d', 0, 0, @ID);
END;
The 0, 0 after the message format string represent the severity and state, respectively. A severity of 0 indicates an informational message.
Conditional SELECT Statements
For inspecting the contents of temporary tables, table variables, or the results of subqueries at various stages, conditional SELECT statements can be very helpful. These would only execute when @Debug is set to an appropriate level.
IF @Debug >= 1
BEGIN
  SELECT * FROM #TempResults;
END;
Handling Dynamic SQL Debugging
If your stored procedure constructs and executes dynamic SQL, including a debug option to print the generated SQL string is highly recommended. This allows you to copy the generated SQL and execute it separately for easier troubleshooting.
DECLARE @sql NVARCHAR(MAX);
SET @sql = 'SELECT * FROM YourTable WHERE ID = ' + CAST(@SomeInputParameter AS VARCHAR(10));

IF @Debug >= 1
BEGIN
  PRINT 'Debug: Dynamic SQL being executed:';
  PRINT @sql;
END;

-- Execute the dynamic SQL (conditionally if you have a 'what-if' mode)
IF @Debug <= 1 -- Execute if debug is 0 or 1 (verbose)
BEGIN
  EXEC sp_executesql @sql;
END;
In this pattern, when @Debug is 1, the generated SQL is printed but still executed. If you have a "what-if" mode (e.g., @Debug = 2), you would add another condition to prevent the actual execution of the dynamic SQL.
Implementing a "What If" Mode
For stored procedures that modify data, a "what-if" mode (e.g., @Debug = 2) is a powerful debugging technique. This involves wrapping your DML statements within a transaction that is always rolled back. This allows you to observe the effects of the DML operations (e.g., by selecting from the modified tables within the transaction) without making permanent changes.
IF @Debug = 2
BEGIN
  BEGIN TRAN;
  -- Your INSERT, UPDATE, DELETE statements here
  -- Add SELECT statements here to see the effect of the DML within the transaction
  IF @Debug >= 1
  BEGIN
    PRINT 'Debug: Executing DML in what-if mode (transaction will be rolled back).';
    -- Example: SELECT * FROM YourTable WHERE ...;
  END;
  ROLLBACK TRAN;
END
ELSE
BEGIN
  -- Actual DML execution
  -- Your INSERT, UPDATE, DELETE statements here
END;
This pattern ensures that the actual data modification only occurs when @Debug is not set to the "what-if" value.
Integration with External Debugging Tools
While adding debug parameters provides internal debugging capabilities, they can also complement external tools like SSMS and SSDT. When using the interactive debugger, you can set the value of the @Debug parameter in the "Edit Parameters" window when starting the debugging session. This allows you to combine step-by-step execution with the verbose output or "what-if" simulation provided by your debug parameter.
Here is a visual representation of setting parameters when debugging:
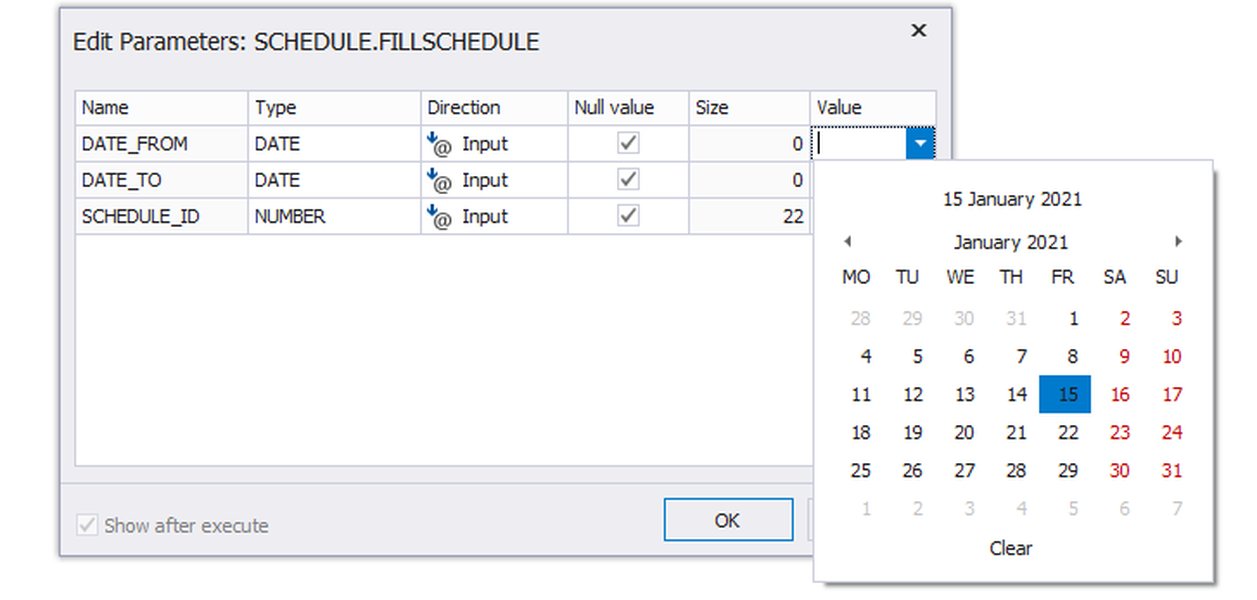
Setting parameters in a debugging session.
SSMS Debugging Capabilities
SSMS provides a built-in debugger that allows you to step through T-SQL code, set breakpoints, and inspect variables and the call stack. While the debugger was temporarily removed in SSMS v18, it was later reintroduced. To use the SSMS debugger, you typically right-click on the stored procedure in the Object Explorer and select "Debug". You can then provide values for the stored procedure's parameters, including your debug parameter.
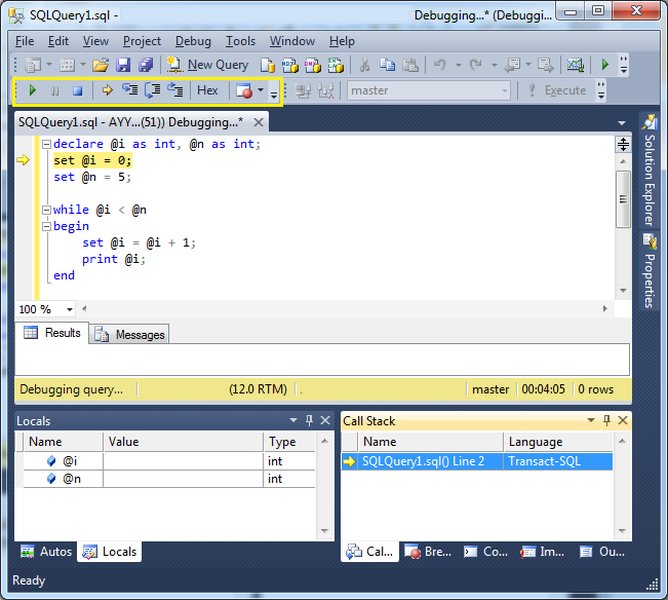
The debugging interface in SSMS.
SSDT and Visual Studio Integration
SQL Server Data Tools (SSDT), integrated with Visual Studio, also offers a powerful T-SQL debugger. This is particularly useful if you are already working within the Visual Studio environment for application development. Debugging stored procedures through SSDT often involves creating a database project. From the SQL Server Object Explorer within Visual Studio, you can right-click a stored procedure and select "Debug Procedure".
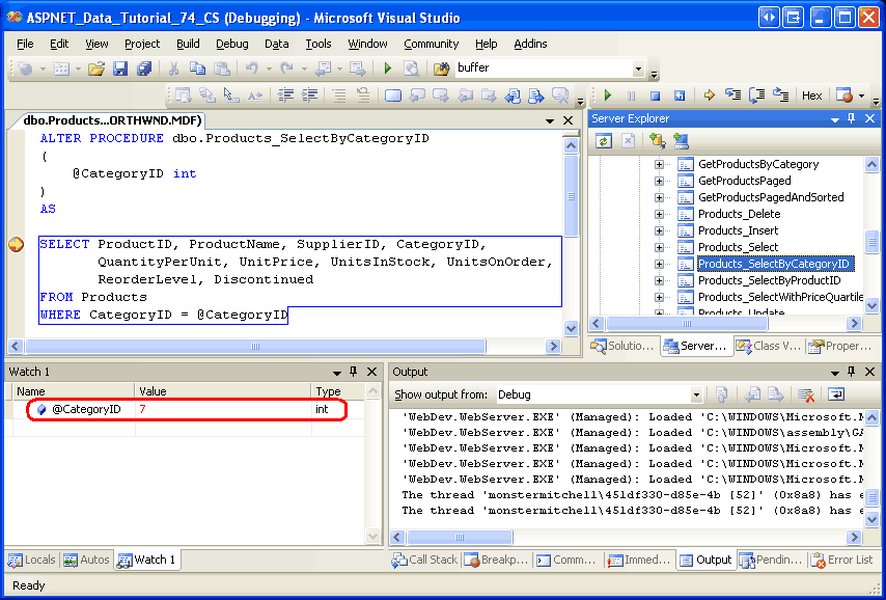
Debugging stored procedures within Visual Studio using SSDT.
Best Practices for Debug Parameters
Default to Off
Always set the default value of the debug parameter to 0 (off). This ensures that when the stored procedure is called by applications or in production, the debugging logic is not inadvertently activated.
Clear Output Messages
Make your debug output messages clear and informative. Include the name of the stored procedure, the values of relevant parameters and variables, and an indication of where in the code the message is being generated.
Avoid Excessive Output
While verbose output can be helpful, avoid flooding the output with too much information, which can make it difficult to find what you're looking for. Use different debug levels to control the amount of output.
Conditional Logic Only
Ensure that all debugging-specific code is enclosed within conditional blocks that check the debug parameter. This prevents the debugging logic from impacting normal execution when debugging is off.
Document Your Debug Levels
Document the different values of your debug parameter and what each level enables. This information should be included in the stored procedure's header comments.
Consider Performance Impact
Be mindful that extensive debugging logic, especially conditional SELECT statements or large amounts of PRINT output, can have a minor performance impact even when the debug parameter is off. Keep the debugging code as lightweight as possible.
Alternative Techniques
While adding a debug parameter is a strong technique, other debugging methods exist. These include commenting out sections of code, changing DML statements to SELECTs during testing, and utilizing SQL Server Profiler or Extended Events to trace execution. Combining these techniques with a debug parameter can provide a comprehensive debugging strategy.
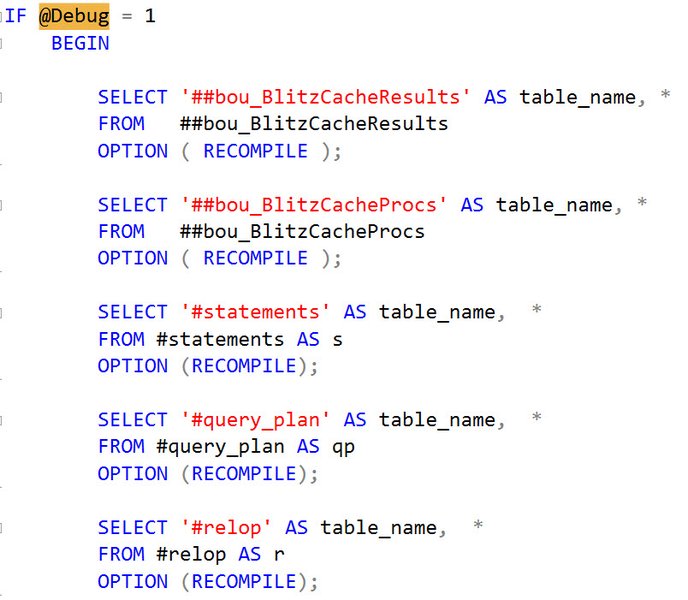
Exploring various methods for debugging SQL Server stored procedures.
Common Debugging Scenarios and Parameter Usage
Here's a table summarizing how a generic debug parameter can be used in various debugging scenarios:
| Scenario | Debug Parameter Usage (@Debug) | Explanation |
|---|---|---|
| Investigating incorrect results | Set @Debug = 1 | Output intermediate variable values and results of subqueries or temporary tables to see how data is being processed at each step. |
| Troubleshooting dynamic SQL | Set @Debug = 1 | Print the generated dynamic SQL string before execution to verify its syntax and content. |
| Testing DML operations safely | Set @Debug = 2 | Execute the stored procedure in "what-if" mode to see the impact of INSERT, UPDATE, or DELETE statements without committing changes. |
| Identifying execution flow issues | Set @Debug = 1 | Use PRINT statements at the beginning of different code blocks (IF/ELSE, loops) to trace the execution path. |
| Debugging performance problems | Set @Debug = 1 (or potentially higher for more detail) | While debug parameters primarily focus on logic, you can output timestamps or messages around expensive operations to get a rough idea of where time is being spent. More advanced performance tuning tools like Profiler/Extended Events are usually better for this. |
Limitations and Considerations
While adding debug parameters is beneficial, it's important to be aware of their limitations:
Performance Overhead
Even with conditional logic, the presence of debugging code adds some overhead to the stored procedure. This is usually negligible when debugging is off, but extensive debugging logic could potentially impact performance.
Code Clutter
Adding significant debugging code can make the stored procedure harder to read and maintain. Strive for a balance between debugability and code clarity.
Security Concerns
Be cautious about the information you output during debugging, especially in production environments. Avoid exposing sensitive data in debug messages.
Not a Replacement for Profiling/Extended Events
Debug parameters are excellent for understanding logic and data flow, but they are not a substitute for performance profiling tools like SQL Server Profiler or Extended Events, which provide detailed information about query execution plans, wait times, and resource usage.
Frequently Asked Questions (FAQ)
Should I remove debug parameters before deploying to production?
It's generally not necessary to remove the debug parameter itself if its default value is set to 0 (off). The conditional logic ensures that the debugging code is not executed during normal operation. However, you might consider removing very verbose or potentially sensitive debug output before a final production deployment, depending on your organization's policies and risk tolerance.
Can I use different names for the debug parameter?
Yes, you can use different names, but @Debug is a widely recognized convention in the SQL Server community. Using a standard name makes your code easier for others to understand and maintain.
Is it possible to debug stored procedures with table-valued parameters using this method?
Yes, you can still use a debug parameter with stored procedures that accept table-valued parameters. You would typically use conditional SELECT * FROM @YourTableValuedParameter; statements within your debugging blocks to inspect the contents of the table variable passed to the procedure.
How can I capture debug output when the stored procedure is called from an application?
The method for capturing debug output (from PRINT or RAISERROR) when a stored procedure is called from an application depends on the application's data access layer and logging mechanisms. Some data access frameworks can capture informational messages from the database. Alternatively, you might consider logging debug information to a dedicated logging table within your database, controlled by the debug parameter.
References
Last updated May 7, 2025