
Comparative Analysis of Approved Budget 2023/2024 FY
Ekurhuleni Municipality vs. Seven Other Metropolitan Municipalities
Key Takeaways
- Ekurhuleni's Revenue Composition: Predominantly reliant on service charges, particularly in electricity and water sectors.
- Expenditure Allocation: Significant portions allocated to operating expenditures, with a notable decrease in capital expenditures compared to previous years.
- Data Discrepancies and Challenges: Issues such as poor electricity revenue collection and income shortfalls highlight fiscal management challenges.
Introduction and Objectives
The 2023/2024 fiscal year has presented significant financial challenges and opportunities for Ekurhuleni Municipality, particularly when compared to seven other metropolitan municipalities in South Africa. This comprehensive analysis aims to provide an in-depth comparison of the approved budgets, focusing on revenue sources, expenditure types, and identifying critical discrepancies and areas of skepticism. The objectives are to enhance fiscal transparency, understand the unique financial dynamics of Ekurhuleni, and offer actionable insights for improved fiscal management.
Budget Overview for Ekurhuleni Municipality 2023/2024
Total Budget Allocation
The Ekurhuleni Municipality's approved consolidated capital budget for the 2023/2024 fiscal year stands at R2.72 billion, marking a decrease of 16.9% from the previous year's adjusted budget. This reduction aligns with broader trends observed in other municipalities, with only Johannesburg exhibiting a moderate increase in capital expenditure.
Revenue Sources
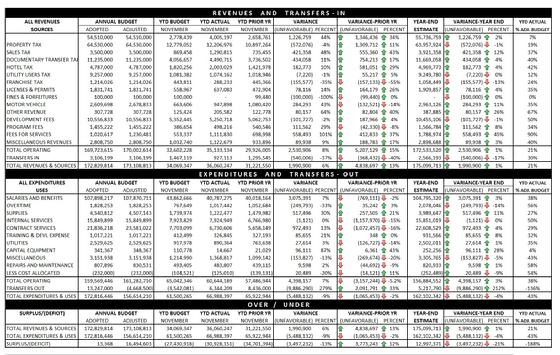
Ekurhuleni's revenue for the 2023/24 fiscal year is projected at R60.67 billion, up from R55.5 billion in the previous year. However, the revenue mix reveals a heavy reliance on service charges, which constitute approximately 66% of the total revenue. The detailed breakdown is as follows:
- Electricity, water, sanitation, and refuse collection charges: R13.165 billion
- Refuse revenue: R1.8 billion
- Interest on outstanding debts: R1.3 billion
- Interest on investments, facility rentals, licenses, permits: R5 billion
- National and provincial government grants: R6.2 billion
Expenditure Types
The total projected expenditure for Ekurhuleni is R60.07 billion, categorized into operating and capital expenditures. Operating expenditures dominate the budget, with significant allocations towards infrastructure development, employee-related costs, and other operational expenses.
Comparison with Other Metropolitan Municipalities
Overview of Metropolitan Municipalities
This analysis includes a comparative review of Ekurhuleni alongside seven other key metropolitan municipalities in South Africa: Johannesburg, Cape Town, eThekwini, Tshwane, Nelson Mandela Bay, Buffalo City, and Mangaung. Each municipality exhibits unique economic and demographic profiles that influence their fiscal strategies.
Revenue Sources Comparison
| Municipality | Service Charges (R Billion) | Property Rates (R Billion) | Government Grants (R Billion) | Other Revenues (R Billion) |
|---|---|---|---|---|
| Ekurhuleni | 13.165 | - | 6.2 | Various |
| Johannesburg | Moderate Increase | - | - | - |
| Cape Town | - | - | - | - |
| eThekwini | - | - | - | - |
| Tshwane | - | - | - | - |
| Nelson Mandela Bay | - | - | - | - |
| Buffalo City | - | - | - | - |
| Mangaung | Decrease | - | - | - |
The table above highlights the variation in service charges across municipalities, with Ekurhuleni demonstrating a significant portion of its revenue from this source. Unlike Ekurhuleni, municipalities like Johannesburg have shown different trends, with some experiencing increases in service charge revenues.
Expenditure Types Comparison
| Municipality | Operating Expenditure (R Billion) | Capital Expenditure (R Billion) |
|---|---|---|
| Ekurhuleni | 26.390 | 2.785 |
| Johannesburg | - | Increased |
| Cape Town | - | - |
| eThekwini | - | - |
| Tshwane | - | - |
| Nelson Mandela Bay | - | - |
| Buffalo City | - | - |
| Mangaung | - | Decrease |
Operating expenditures form the bulk of Ekurhuleni's budget, with a substantial allocation towards infrastructure and public services. Compared to other municipalities, only Johannesburg has shown a distinct increase in capital expenditures, indicating differing strategic priorities.
Revenue Diversification
While Ekurhuleni relies heavily on service charges, other municipalities exhibit varied revenue sources. A diversified revenue base can mitigate risks associated with dependency on a single source, enhancing fiscal stability and resilience against economic fluctuations.
Revenue Sources Analysis
Detailed Breakdown
Ekurhuleni's revenue structure is predominantly composed of service charges, totaling approximately 66% of the overall revenue. This heavy reliance on service charges, particularly in electricity and water, underscores the municipality's dependency on utility revenues. The breakdown is as follows:
- Electricity, Water, Sanitation, and Refuse Collection Charges: R13.165 billion
- Refuse Revenue: R1.8 billion
- Interest on Outstanding Debts: R1.3 billion
- Interest on Investments, Facility Rentals, Licenses, Permits: R5 billion
- National and Provincial Government Grants: R6.2 billion
Implications of Revenue Composition
The significant portion of revenue derived from service charges places Ekurhuleni in a position where fluctuations in utility usage and collection efficiency directly impact fiscal health. For instance, challenges such as poor electricity revenue collection, illegal connections, and high tariffs can lead to substantial income shortfalls, as evidenced by a 24% shortfall in the first quarter of the 2024/25 financial year.
Comparison with Peer Municipalities
In contrast, other metropolitan municipalities may have a more balanced revenue portfolio, incorporating a higher proportion of property rates and diversified grants. This diversification can provide a buffer against sector-specific downturns, enhancing overall fiscal stability.
Expenditure Types Analysis
Operating vs. Capital Expenditures
Ekurhuleni's expenditure for the 2023/24 fiscal year is categorized into operating and capital expenditures. Operating expenditures, amounting to R26.390 billion, encompass infrastructure development, employee-related costs, and other operational expenses. Capital expenditures, at R2.785 billion, focus on long-term investments such as infrastructure projects.
Trends in Expenditure Allocation
The decrease in capital expenditure by 16.9% from the previous year reflects a broader trend of fiscal austerity observed in several municipalities. While reducing capital expenditure can help in short-term budget stabilization, it may impede long-term infrastructure development and service delivery improvements.
Comparative Expenditure Efficiency
When compared to other municipalities, Ekurhuleni's allocation towards operating expenditures is substantial. However, the reduced capital investment could signal potential delays in critical infrastructure projects, potentially affecting the municipality's competitiveness and service quality.
Impact on Public Services
Operating expenditures directly influence the quality and availability of public services such as health, education, safety, and transportation. Efficient allocation and management of these funds are crucial for meeting public needs and ensuring sustainable urban development.
Discrepancies and Skeptical Interests
Identified Discrepancies
The budget analysis reveals several areas where discrepancies and potential issues exist:
- Revenue Collection Challenges: Poor electricity revenue collection due to high tariffs, illegal connections, and customer shift to alternative power sources.
- Income Shortfall: A 24% income shortfall in the first quarter highlights inefficiencies in revenue management.
- Reporting Inconsistencies: Variations in reported figures across different sources create challenges in accurate financial assessment.
- Expenditure Allocation: Significant reduction in capital expenditure may not align with public infrastructure needs.
Implications of Discrepancies
These discrepancies can undermine fiscal transparency and erode public trust in municipal financial management. They also pose challenges for effective budgeting and resource allocation, potentially leading to inefficiencies and compromised service delivery.
Skeptical Interests and Critical Analysis
It is essential to critically assess the budget data to identify underlying causes of discrepancies. Factors such as varied accounting practices, policy differences, and reporting errors must be examined to ensure accurate financial representation and accountability.
Recommendations for Addressing Discrepancies
To mitigate these issues, the following strategies are recommended:
- Enhanced Revenue Collection Mechanisms: Implement robust systems to improve utility revenue collection and reduce losses from illegal connections.
- Standardized Reporting Practices: Adopt uniform accounting and reporting standards across municipalities to ensure data consistency and reliability.
- Increased Fiscal Oversight: Strengthen oversight mechanisms to monitor expenditure allocation and usage effectively.
- Transparent Auditing Processes: Conduct regular and transparent audits to identify and address financial discrepancies promptly.
Case Study: Ekurhuleni’s Budget Management
Strengths in Budget Management
Ekurhuleni exhibits strengths in certain areas of budget management, including a diversified approach to revenue through various service charges and strategic investments in infrastructure development. The municipality's ability to secure substantial government grants also provides a stable revenue base.
Vulnerabilities and Challenges
Despite these strengths, vulnerabilities persist, particularly in revenue collection efficiency and expenditure allocation. The heavy reliance on service charges makes the municipality susceptible to fluctuations in utility usage and collection challenges. Additionally, the reduction in capital expenditure may hinder long-term infrastructure projects, affecting service quality and urban development.
Comparative Best Practices
In comparison to higher-performing municipalities, Ekurhuleni can adopt best practices such as:
-
Diversifying Revenue Streams: Incorporate a broader range of revenue sources, including enhanced property rate collections and diversified grants.
-
Investing in Revenue Collection Technology: Utilize advanced technologies to monitor and improve utility revenue collection and reduce illegal connections.
-
Strategic Capital Investment: Prioritize capital expenditures that support sustainable infrastructure development and long-term service improvements.
-
Enhanced Fiscal Oversight: Implement comprehensive oversight mechanisms to ensure efficient and transparent budget management.
Future Outlook and Recommendations
Moving forward, Ekurhuleni Municipality should focus on strengthening its revenue collection systems, diversifying its revenue base, and ensuring equitable and strategic allocation of expenditures. By addressing current vulnerabilities and adopting best practices, the municipality can enhance fiscal stability and improve service delivery outcomes.
Conclusion
The comparative analysis of Ekurhuleni Municipality's approved budget for the 2023/2024 fiscal year against seven other metropolitan municipalities reveals both strengths and significant challenges. While Ekurhuleni demonstrates a robust revenue base predominantly sourced from service charges and government grants, the heavy reliance on these sectors exposes the municipality to fiscal vulnerabilities related to revenue collection inefficiencies and reduced capital investment.
Key discrepancies, such as income shortfalls and reporting inconsistencies, underscore the need for enhanced fiscal management and transparency. Adopting best practices from higher-performing municipalities, diversifying revenue streams, and strengthening oversight mechanisms are critical steps towards achieving fiscal stability and improving service delivery.
Ultimately, addressing these challenges will not only bolster Ekurhuleni's financial health but also ensure the municipality can effectively meet the needs of its residents through sustainable and transparent fiscal practices.
References
Last updated February 16, 2025