
Unlocking the Demographics of High IQ: Which Ethnic Groups Are Most Represented Above 130?
Exploring the intersection of ethnicity and exceptional cognitive ability based on available data.
Understanding the distribution of high intelligence quotient (IQ) scores across different populations is a complex subject, often intertwined with sensitive discussions about ethnicity, genetics, and environment. An IQ score of 130 or above places an individual in the "very superior" range, typically representing the top 2-2.2% of the general population. While intelligence is an individual trait, statistical analyses of average IQ scores across large ethnic groups reveal certain patterns regarding representation at this high threshold.
Highlights: Key Insights into High IQ Representation
- Top Tier Representation: Data consistently suggests that individuals of Ashkenazi Jewish and East Asian descent are statistically more common among those with IQ scores of 130 and above, primarily due to higher average group IQ scores.
- Statistical Correlation: The higher representation of certain groups in the 130+ IQ range is largely explained by their higher mean IQ scores; the normal distribution (bell curve) of IQ means that a higher average shifts more individuals into the upper tail.
- Complex Influences: Observed differences in average IQ and high-IQ representation are influenced by a complex interplay of environmental, socio-economic, educational, and cultural factors, alongside ongoing debate about potential genetic influences. It's crucial to avoid simplistic or deterministic interpretations.
Understanding the IQ 130 Threshold
What Does Scoring 130+ Mean?
An IQ score is a standardized measure of cognitive abilities relative to a population group. The scoring is typically normalized so that the average score is 100, with a standard deviation of 15 points. Achieving a score of 130 places an individual two standard deviations above the mean.
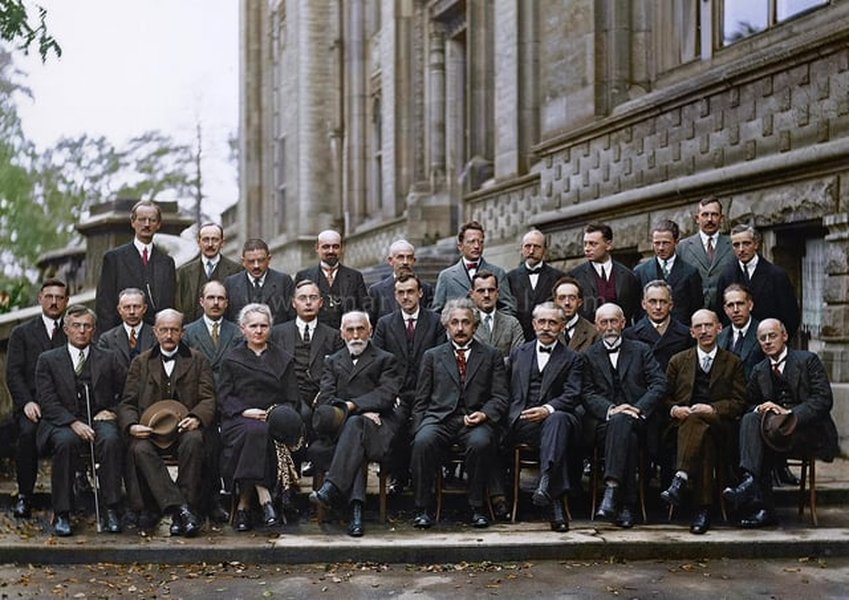
Representation of high intellect: The 1927 Solvay Conference gathered many of the world's leading physicists.
Percentile Rank
Scoring 130 or higher corresponds to the 98th percentile. This means that only about 2% of the general population achieves such scores. This level of cognitive ability is often associated with giftedness and is a common benchmark for entry into high-IQ societies.
Cognitive Abilities
Individuals in this range typically exhibit exceptional abilities in areas such as abstract reasoning, problem-solving, learning capacity, and complex information processing. However, IQ scores measure only a specific set of cognitive skills and do not encompass creativity, emotional intelligence, or practical skills.
Ethnic Representation Among Individuals with IQ 130+
Patterns Based on Average Group Scores
While IQ is an individual characteristic, studies analyzing average IQ scores across different ethnic groups provide insights into which groups might be statistically more represented at the 130+ level. This representation is primarily a function of the group's average IQ score and the shape of the IQ distribution curve.
Ashkenazi Jews
Multiple sources indicate that Ashkenazi Jews have the highest average IQ scores among documented ethnic groups, often estimated to be between 110 and 115. This significantly higher mean score statistically results in a larger proportion of this group exceeding the 130 IQ threshold compared to the global average. Consequently, they are frequently cited as being overrepresented in populations scoring 130 and above.
East Asians
Populations of East Asian descent (including Chinese, Japanese, Koreans, and Taiwanese) consistently demonstrate high average IQ scores, typically reported around 105-106. This places them above the global average and significantly higher than many other groups. As a result, East Asians also show a higher statistical likelihood of scoring 130 or above and are considered one of the most common groups in this high-IQ range.
European Populations (Whites)
Individuals of European descent generally have average IQ scores around the global benchmark of 100. Their representation in the 130+ IQ category aligns closely with the overall population statistic of approximately 2%. While contributing a significant number of high-IQ individuals due to large population sizes in many Western countries, their proportional representation is typically lower than that of Ashkenazi Jews and East Asians.
Other Ethnic Groups
Ethnic groups with reported average IQ scores below the global mean of 100 (such as African Americans, Hispanics, and Native Americans, with averages often cited in the 85-95 range in various studies) tend to have a proportionally smaller representation among those scoring 130 and above. It is crucial to remember that these are statistical averages; high-IQ individuals exist within every ethnic group, and within-group variation in IQ is substantial.
Statistical Basis for Representation Differences
The Role of Mean IQ and Distribution
The variation in representation among the 130+ IQ population stems directly from differences in average (mean) IQ scores between groups, assuming a relatively similar standard deviation (spread) of scores within each group (typically around 13-15 points).
Imagine the IQ distribution as a bell curve. For a group with a mean IQ of 100, the curve is centered at 100, and the area under the curve beyond the 130 mark represents about 2.2% of the group.
If a group has a higher mean IQ, say 110, the entire bell curve shifts to the right. Even with the same shape (standard deviation), the portion of the curve extending beyond 130 becomes significantly larger. For a mean of 110, roughly 8-10% might score above 130. Conversely, for a group with a mean IQ of 85, the curve shifts left, and the percentage scoring above 130 becomes very small.
This statistical reality explains why groups with higher average IQs, like Ashkenazi Jews and East Asians, are more frequently observed in the high-IQ stratum.
Visualizing Factors in IQ Distribution
The following mindmap illustrates the key elements influencing how IQ scores are distributed within and across populations, leading to variations in representation at high IQ levels like 130+.
Average IQ Scores Across Groups: A Comparative Overview
Estimated Mean IQs from Various Studies
The table below summarizes estimated average IQ scores for several broad ethnic groups, based on data referenced in the provided materials. It's important to treat these figures as estimates derived from specific studies and populations, which can vary. These averages are central to understanding the statistical representation differences at the high end of the IQ scale.
| Ethnic Group | Estimated Average IQ (Approximate Range/Value) | Source Basis |
|---|---|---|
| Ashkenazi Jews | 110 - 115 | Multiple studies cited in Answers B & C |
| East Asians (Chinese, Japanese, Koreans, Taiwanese) | 105 - 106 | Multiple studies cited in Answers B, C & D |
| Europeans (Whites) | ~100 | Answers A, B & C (Global benchmark) |
| Hispanics (in US studies) | ~90 - 95 | Mentioned indirectly in Answer C |
| African Americans (in US studies) | ~85 - 90 | Mentioned indirectly in Answer C |
| Amerindians / Eskimos (North America) | ~86 / ~91 | Mentioned in Answer A |
Note: These values are statistical averages from specific research contexts and are subject to debate regarding methodology, sampling, and influencing factors. They do not predict individual IQ scores.
Factors Influencing IQ Scores and Representation
Beyond the Numbers: A Complex Web of Influences
While average IQ scores correlate with representation in the high-IQ range, attributing these differences solely to ethnicity or genetics is an oversimplification. A wide array of interconnected factors contribute to cognitive development and test performance:

Educational environments and opportunities play a critical role in cognitive development.
- Socio-Economic Status (SES): Factors like parental income, education level, and occupation strongly correlate with children's IQ scores. Access to resources, quality nutrition, healthcare, and stimulating environments varies significantly with SES.
- Education: The quality, duration, and type of schooling have a demonstrable impact on IQ scores. Access to enriching educational opportunities differs across and within ethnic groups.
- Cultural Factors: Cultural attitudes towards education, learning, and specific cognitive skills measured by IQ tests can influence performance. Acculturation levels can also impact scores for minority groups.
- Health and Nutrition: Early childhood nutrition, exposure to environmental toxins (like lead), and overall health status are known to affect brain development and cognitive function.
- Test Bias: Some researchers argue that standard IQ tests may contain cultural biases that disadvantage individuals from certain backgrounds, though test makers strive to minimize this.
- Stereotype Threat: Psychological phenomena like stereotype threat (where individuals underperform due to anxiety about confirming negative stereotypes related to their group) can affect test scores.
- Genetics: While intelligence is known to be heritable within families, the extent to which genetic differences contribute to average IQ differences between large ethnic groups is highly debated and lacks scientific consensus. Most experts emphasize the significant role of environmental factors in explaining group differences.
It's also vital to remember that the variability of IQ scores within any ethnic group is much larger than the average difference between groups.
Visualizing Hypothetical Group Profiles
A Radar Chart Perspective on Contributing Factors
This radar chart offers a speculative visualization of how different factors might hypothetically contribute to the cognitive performance profiles associated with certain groups, leading to variations in high-IQ representation. The scores are illustrative opinions based on the preceding discussion and averages reported in studies, not precise data points. They aim to represent relative strengths or advantages often discussed in relation to these groups concerning factors influencing IQ outcomes.
This chart visualizes how the interplay of multiple factors, not just average IQ, contributes to the overall profile often associated with different groups' cognitive outcomes. Higher scores across multiple domains might correlate with higher representation at the top end of the IQ spectrum.
The Debate on Race, Genetics, and Intelligence
Navigating a Controversial Topic
The discussion around ethnic group differences in IQ scores inevitably touches upon the sensitive and controversial topic of race, genetics, and intelligence. While average differences are observed statistically, the scientific community emphasizes caution.
There is no broad scientific consensus supporting the idea that observed average IQ differences between ethnic groups are primarily determined by genetic factors. Most experts point to the significant and undeniable impact of environmental variables, socioeconomic disparities, educational inequities, and potential testing biases as major contributors to these differences. The concept of "race" itself is increasingly understood as a social construct rather than a precise biological category, further complicating genetic interpretations.
The following video explores some aspects of the discourse surrounding race and IQ, highlighting the complexities and potential consequences of these discussions.
Understanding the statistical patterns is important, but it should be done with an awareness of the historical misuse of IQ data and the complex, multi-faceted nature of human intelligence and its development.
Frequently Asked Questions (FAQ)
Clarifying Common Queries
What does an IQ score of 130 actually signify?
An IQ score of 130 signifies "very superior" intelligence according to most standardized IQ test classifications. It places an individual in the top 2-2.2% of the population (98th percentile). This generally indicates exceptional abilities in reasoning, problem-solving, abstract thinking, and learning speed compared to the general population.
Are Ashkenazi Jews and East Asians genetically predisposed to higher IQs?
This is a highly debated and controversial topic with no definitive scientific consensus. While these groups have higher average measured IQ scores, most researchers emphasize the significant role of environmental factors, including socio-economic advantages, strong cultural emphasis on education and intellectual pursuits, historical circumstances, and potentially selective pressures unrelated to general intelligence. Attributing the difference primarily to genetics is not supported by mainstream science, which highlights the complexity and interplay of many factors.
Why do average IQ scores differ between ethnic groups?
Average IQ differences between ethnic groups are attributed to a complex combination of factors. These include disparities in socio-economic status (income, parental education), access to quality education and healthcare, nutritional differences, cultural factors influencing test-taking or cognitive skills development, exposure to environmental toxins, and potential test biases. The relative contribution of each factor is difficult to disentangle and is a subject of ongoing research and debate.
Can environmental factors change IQ scores?
Yes, environmental factors have a significant impact on IQ scores, both for individuals and populations over time. Improvements in nutrition, healthcare, education quality and accessibility, and overall living standards are associated with increases in average IQ scores – a phenomenon known as the Flynn Effect. Conversely, deprivation, poor health, and lack of educational opportunities can negatively impact cognitive development and measured IQ.
Recommended
Explore Further Insights
- What factors contribute most to high IQ scores?
- How has the average IQ changed over time globally (Flynn Effect)?
- What is the relationship between socioeconomic status and IQ?
- Are there limitations or biases in standard IQ testing methods?
References
Sources Used in This Analysis
Last updated April 30, 2025