
Beyond Stocks: Unlocking the Secrets to Evaluating ETF Resilience in Uncertain Times
Discover the essential metrics to assess ETF strength and potential stability during economic downturns, even without traditional stock data.
You're right to think differently about evaluating Exchange-Traded Funds (ETFs) compared to individual stocks, especially when considering potential economic headwinds like a recession. Since an ETF is a basket of securities (stocks, bonds, commodities, etc.), metrics like debt-to-equity or free cash flow per share for the ETF itself don't exist. Instead, assessing an ETF's potential strength and solvency during negative market conditions involves looking at its structure, costs, the characteristics of its underlying holdings in aggregate, and its risk profile. Let's dive into the fundamental metrics and factors you should focus on.
Highlights: Key Factors for Evaluating ETFs in a Downturn
- Focus on Aggregate Holdings & Sector Allocation: Understand the collective valuation (like P/E, P/B ratios) and quality of the assets the ETF holds, and prioritize defensive sectors (consumer staples, healthcare, utilities) known for relative stability.
- Prioritize Cost Efficiency and Risk Management: Low expense ratios become crucial when returns are scarce. Metrics like Beta and Sharpe Ratio help gauge volatility and risk-adjusted performance, identifying potentially more stable investments.
- Assess Structure, Liquidity, and Tracking: Ensure the ETF is well-managed (low tracking error, minimal NAV premium/discount), sufficiently liquid (high AUM and trading volume), and less likely to face closure during market stress.
Deconstructing ETF Resilience: Core Metrics Explained
Evaluating an ETF for potential resilience requires a multi-faceted approach. While you can't analyze an ETF like a single company, several key metrics provide deep insights into its potential behavior during market stress.
1. Analyzing the Underlying Portfolio
The heart of an ETF lies in its holdings. Understanding the collective characteristics of these assets is paramount, especially when assessing potential performance during a recession.
Aggregate Valuation Metrics
- Price-to-Earnings (P/E) Ratio (Weighted Average): This reflects the average valuation of the stocks within the ETF relative to their earnings. A lower aggregate P/E might suggest the underlying stocks are less overvalued and potentially more resilient to market corrections. During downturns, companies with stable earnings (often found in defensive sectors) might maintain more reasonable P/E ratios. Compare the ETF's P/E to its benchmark or sector peers.
- Price-to-Book (P/B) Ratio (Weighted Average): This compares the market value of the ETF's holdings to their collective book value (assets minus liabilities). A lower P/B ratio can indicate that the underlying assets are potentially undervalued or backed by more tangible assets, which could offer a cushion during market stress. This is particularly relevant for value-oriented ETFs or those in sectors like financials or utilities.
Portfolio Quality & Composition
- Sector and Geographic Allocation: Examine the ETF's exposure. Heavy concentration in cyclical sectors (e.g., technology, consumer discretionary, industrials) can increase vulnerability in a recession. Conversely, ETFs focused on defensive sectors like consumer staples, healthcare, utilities, and sometimes real estate tend to hold up better as demand for their goods/services is less sensitive to economic cycles. Diversification across regions can also mitigate country-specific risks.
- Quality of Underlying Assets: While direct metrics like debt-to-equity aren't available for the ETF, some providers offer aggregate data (like weighted average debt-to-equity or ROE) for the holdings. Lower average debt suggests underlying companies are less leveraged and potentially more stable. For bond ETFs, credit quality (average credit rating) and Weighted Average Effective Duration (sensitivity to interest rate changes) are critical. Shorter durations are generally less risky if interest rates rise unexpectedly, which can sometimes accompany economic uncertainty.
- Concentration Risk: Check the percentage allocated to the top 10 holdings. High concentration in a few names increases risk if those specific companies underperform. Greater diversification across holdings is generally preferred for stability.
- Dividend Yield and Stability: ETFs focused on dividend-paying stocks, especially those with a history of stable or growing dividends (often found in defensive sectors), can provide a source of return even when capital appreciation is negative. Assess the sustainability of dividends based on the underlying holdings' payout ratios and earnings stability.
Analyzing underlying holdings often involves examining financial charts and data provided by fund managers or third-party services.
2. Cost Efficiency: The Expense Ratio
The Expense Ratio (or Total Expense Ratio - TER) represents the annual cost of owning the ETF, covering management fees, administrative costs, and operating expenses. Expressed as a percentage of the fund's assets, this fee directly reduces your net return.
- Relevance in a Downturn: When market returns are low, flat, or negative, fees have a much larger impact on your overall performance. A lower expense ratio means less "drag" on your investment, preserving more capital. For long-term holds, especially through challenging periods, minimizing costs is crucial.
- Interpretation: Generally, lower is better. Passive index-tracking ETFs often have very low expense ratios (e.g., below 0.20%), while actively managed or thematic ETFs might charge more. Compare the ratio to similar ETFs in the same category.
3. Risk and Performance Metrics
These metrics help quantify the ETF's volatility and how effectively it has generated returns relative to the risk taken.
Volatility Measures
- Beta: Measures the ETF's price sensitivity relative to a benchmark (often the S&P 500). A beta of 1.0 means the ETF tends to move with the market. A beta less than 1.0 suggests lower volatility than the market, which is often desirable during downturns. Defensive sector ETFs or low-volatility ETFs typically aim for lower betas (e.g., 0.5-0.8).
- Standard Deviation: Measures the dispersion of an ETF's returns around its average return; a higher standard deviation indicates greater volatility. Low-volatility ETFs specifically select stocks with historically lower price fluctuations.
Risk-Adjusted Return
- Sharpe Ratio: Measures the ETF's return per unit of risk (volatility), adjusted for the risk-free rate. A higher Sharpe ratio indicates better risk-adjusted performance – the ETF generated more return for the risk it took. During uncertain times, ETFs that have historically maintained a positive Sharpe ratio might be more adept at navigating volatility.

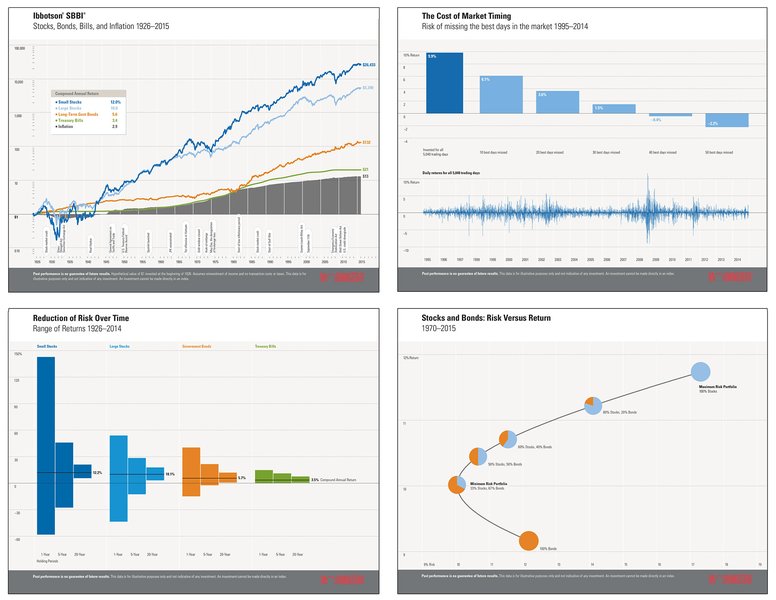
Market conditions, like concentrated rallies shown here, can influence ETF performance and risk metrics.
4. Structural and Trading Metrics
These factors relate to the ETF's operational efficiency, liquidity, and stability.
- Assets Under Management (AUM): The total market value of assets held by the ETF. Higher AUM (e.g., >$500 million or >$1 billion) generally indicates greater investor confidence, better liquidity, potentially tighter bid-ask spreads, and a lower risk of the fund being liquidated by the provider. During market stress, larger ETFs tend to be more stable.
- Average Daily Trading Volume & Bid-Ask Spread: High trading volume signifies good liquidity, meaning you can buy or sell shares easily without significantly impacting the price. A tight bid-ask spread (the difference between the highest price a buyer will pay and the lowest price a seller will accept) means lower transaction costs. Good liquidity is crucial during volatile periods when you might need to adjust positions quickly.
- Tracking Error: Measures how closely a passive ETF's performance matches its benchmark index. A low tracking error indicates the fund is effectively doing its job of replicating the index. This predictability is valuable in uncertain times.
- Premium/Discount to Net Asset Value (NAV): Compares the ETF's market trading price to the per-share value of its underlying assets (NAV). Ideally, the market price should trade very close to the NAV. Significant or persistent premiums (trading above NAV) or discounts (trading below NAV) can indicate potential issues with liquidity or the ETF's creation/redemption mechanism, which could be exacerbated during market stress. A small range (e.g., +/- 0.5% or less) is generally considered healthy.
Visualizing ETF Characteristics for Downturns
Comparing potential ETF investments across key resilience factors can be complex. Visual tools can help illustrate these comparisons.
Comparative Resilience Potential: Radar Chart
This radar chart provides a hypothetical comparison of three ETF types based on metrics relevant to recession resilience. Scores are illustrative (1=Low, 10=High) representing potential strengths:
- Defensive Sector ETF: Focuses on sectors like consumer staples or healthcare.
- Low Volatility ETF: Selects stocks with historically stable prices.
- Broad Market ETF: Tracks a major index like the S&P 500.
As illustrated, Defensive and Low Volatility ETFs often score higher on factors like low beta and defensive exposure, while a Broad Market ETF might excel in cost efficiency and liquidity but carry higher market risk (lower beta score, lower defensive exposure).
Mindmap: Key ETF Evaluation Factors
This mindmap provides a structured overview of the primary areas to consider when evaluating an ETF's potential resilience during economic uncertainty.
This visual breakdown helps organize the different facets involved in a thorough ETF assessment for challenging market conditions.
Understanding ETF Analysis Through Video
Watching experts walk through the process can provide valuable context. This video offers a practical guide on how to analyze ETFs, covering aspects relevant to making informed decisions.
The video likely covers steps such as using screeners, examining fact sheets for key metrics (like those discussed above), understanding index methodology, and considering diversification benefits – all crucial elements when evaluating an ETF's suitability, particularly in anticipation of economic volatility.
Synthesizing Key Metrics for Recession Readiness
To consolidate the evaluation process, the following table summarizes key metrics and their significance when assessing an ETF's potential strength during a recession.
| Metric | Description | Significance in Recession | Desirable Trend for Resilience |
|---|---|---|---|
| Expense Ratio (TER) | Annual fee as % of assets | High fees erode returns, especially when gains are low/negative. | Lower (e.g., < 0.50%, ideally < 0.20%) |
| Beta | Volatility relative to the market | Lower beta implies less sensitivity to broad market downturns. | Lower (e.g., < 1.0, ideally < 0.8) |
| Sharpe Ratio | Risk-adjusted return | Higher ratio indicates better return for the level of risk taken. | Higher (consistently positive over time) |
| Aggregate P/E Ratio | Average valuation of underlying stocks | Lower P/E may indicate less downside risk from overvaluation. | Lower or stable, relative to benchmark/peers |
| Sector Allocation | Exposure to different economic sectors | Defensive sectors (staples, health, utilities) tend to be more stable. | Higher allocation to defensive sectors |
| Assets Under Management (AUM) | Total value of assets in the fund | Higher AUM suggests stability, liquidity, lower closure risk. | Higher (e.g., > $500 Million) |
| Trading Volume / Liquidity | Ease of buying/selling shares | Essential for executing trades efficiently during volatile periods. | Higher volume, tighter bid-ask spread |
| Tracking Error | Deviation from benchmark performance (passive ETFs) | Low error ensures predictable performance aligned with the index. | Lower (e.g., < 0.5%) |
| Dividend Yield / Stability | Income distribution / consistency | Provides potential return buffer; stable dividends signal financial health. | Moderate to high yield with history of stability/growth |
| Weighted Avg. Duration (Bond ETFs) | Sensitivity to interest rate changes | Shorter duration reduces risk if rates rise during economic turmoil. | Shorter (depends on rate outlook, but often < 5-7 years) |
By systematically reviewing these metrics using resources like ETF provider websites, financial data platforms (e.g., Morningstar, ETF.com), and brokerage research tools, you can build a comprehensive picture of an ETF's potential resilience.

Building a resilient portfolio involves carefully selecting ETFs based on metrics suited for potential downturns.
Frequently Asked Questions (FAQ)
References
For further reading and data gathering, consult these resources:
- How To Evaluate ETF Performance - Investopedia
- How to Tell If an ETF Is Overvalued - ETF.com
- Indicators for Analyzing an ETF Investment - Alexon Capital
- Analyzing Exchange-Traded Funds Performance: Key Metrics - Enrichest
- How To Choose The Right ETF For You - Blue Haven Capital
- How to Benchmark Your ETF Investments - Investopedia
- Best Defensive ETFs For Plunging Markets - Bankrate
Recommended Reading
Explore related topics to deepen your understanding:
Last updated April 20, 2025