
Listing Unique Values from a Column in Power Query
A comprehensive guide to extracting distinct values using Power Query in Excel and Power BI.
Key Highlights
- Table.Distinct: Use the Table.Distinct function in Power Query to remove duplicate rows and extract unique values from a table column.
- List.Distinct: Apply the List.Distinct function to a specific column to return a list of unique values.
- Remove Duplicates Feature: Utilize the "Remove Duplicates" feature directly within the Power Query editor for a straightforward approach.
Power Query is a powerful data transformation and preparation tool available in both Excel and Power BI. Extracting unique values from a column is a common task when cleaning and shaping data. This article will guide you through various methods to achieve this, ensuring you can efficiently manage and analyze your data.
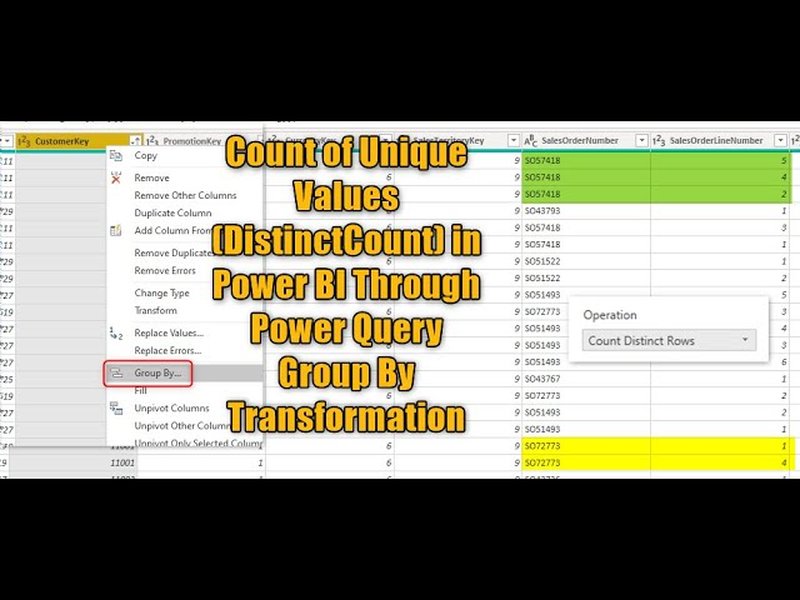
DistinctCount in Power BI Through Power Query Group By Transformation
Understanding Power Query
Power Query allows you to import data from various sources, transform it according to your needs, and load it into Excel or Power BI for analysis and visualization. Extracting unique values is a crucial step in data preparation, ensuring that you are working with a clean and distinct dataset. Whether you are identifying unique customer IDs, product names, or any other categorical data, Power Query provides several methods to accomplish this task.
Why Extract Unique Values?
- Data Cleaning: Removing duplicates ensures accurate analysis and reporting.
- Performance: Working with unique values can improve the performance of your data models.
- Relationship Building: Unique values are often used to create relationships between tables in Power BI.
- Reporting: Distinct lists can be used for creating filters or categories in reports.
Methods to Extract Unique Values in Power Query
There are several ways to extract unique values from a column in Power Query. Each method has its own advantages, depending on the specific requirements of your data transformation process. Here are some of the most effective techniques:
1. Using Table.Distinct Function
The Table.Distinct function is a straightforward way to remove duplicate rows from a table. This function can be applied to the entire table or specific columns, making it versatile for various scenarios.
Steps:
- Load Your Data: Import your data into Power Query using the "From Table/Range" option in the "Get & Transform Data" section of the Data tab.
- Select the Column: Choose the column from which you want to extract unique values.
- Apply Table.Distinct:
- In the Power Query Editor, go to the "Home" tab.
- Click on "Remove Rows" and select "Remove Duplicates". This applies Table.Distinct to the selected column.
- Load the Result: Close and Load the transformed data back into Excel or Power BI.
The Table.Distinct function removes all duplicate rows based on the selected column, leaving you with only the unique values.
2. Using List.Distinct Function
The List.Distinct function is specifically designed to extract unique values from a list. To use this function, you first need to convert the column into a list.
Steps:
- Load Your Data: Import your data into Power Query.
- Select the Column: Choose the column from which you want to extract unique values.
- Convert to List:
- Right-click on the column header.
- Select "Convert to List".
- Apply List.Distinct:
- Go to the "View" tab and open the "Advanced Editor".
- Modify the M code to apply the List.Distinct function:
let
    Source = Excel.CurrentWorkbook(){[Name="YourTable"]}[Content],
    #"Converted to Table" = Table.FromList(Source[YourColumn], Splitter.SplitByNothing(), null, null, ExtraValues.Error),
    #"Removed Duplicates" = List.Distinct(#"Converted to Table"[Column1])
in
    #"Removed Duplicates"
In this code:
Sourcerefers to your data source.#"Converted to Table"converts the column to a list.#"Removed Duplicates"applies the List.Distinct function to remove duplicates.
- In the "Advanced Editor", modify the code:
let
    Source = Excel.CurrentWorkbook(){[Name="YourTable"]}[Content],
    #"Converted to Table" = Table.FromList(Source[YourColumn], Splitter.SplitByNothing(), null, null, ExtraValues.Error),
    #"Removed Duplicates" = List.Distinct(#"Converted to Table"[Column1]),
    #"Converted to Table1" = Table.FromList(#"Removed Duplicates", Splitter.SplitByNothing(), null, null, ExtraValues.Error),
    #"Renamed Columns" = Table.RenameColumns(#"Converted to Table1",{{"Column1", "UniqueValues"}})
in
    #"Renamed Columns"
#"Converted to Table1"converts the list back to a table.#"Renamed Columns"renames the column to "UniqueValues".
3. Using "Remove Duplicates" Feature in the UI
Power Query provides a user-friendly interface to remove duplicates directly from the column. This method is suitable for users who prefer a visual approach without writing code.
Steps:
- Load Your Data: Import your data into Power Query.
- Select the Column: Choose the column from which you want to extract unique values.
- Remove Duplicates:
- Right-click on the column header.
- Select "Remove Duplicates".
- Load the Result: Close and Load the transformed data.
This method is the simplest and most direct way to extract unique values, especially for users who are new to Power Query.
4. Group By Transformation for Distinct Count
If you need to count the number of unique values in a column while also performing other aggregations, the "Group By" transformation is an excellent choice. This method is particularly useful when you want to find distinct counts for each category in another column.
Steps:
- Load Your Data: Import your data into Power Query.
- Select the Columns: Choose the columns you want to group by and the column for which you want to count unique values.
- Apply Group By:
- Go to the "Transform" tab and click on "Group By".
- In the "Group By" dialog:
- Select the column(s) to group by.
- Add a new aggregation:
- Operation: "Count Distinct Rows".
- Column: Select the column for which you want to count unique values.
- New column name: Enter a name for the new column (e.g., "DistinctCount").
- Load the Result: Close and Load the transformed data.
This method gives you a table with grouped columns and a new column containing the distinct count of the specified column.
5. Extracting Unique Values from Multiple Columns
To extract unique values from multiple columns, you can combine the columns into a single column and then apply the methods described above.
Steps:
- Load Your Data: Import your data into Power Query.
- Merge Columns:
-
Select the columns you want to combine.
-
Right-click and select "Merge Columns".
-
Choose a separator (e.g., comma) and a name for the merged column.
-
- Extract Unique Values: Apply any of the methods (Table.Distinct, List.Distinct, or "Remove Duplicates") to the merged column.
- Load the Result: Close and Load the transformed data.
This approach is useful when you need to consider combinations of values across multiple columns as unique identifiers.
M Code Examples for Advanced Users
For advanced users, writing M code directly can provide more control and flexibility. Here are a few examples of how to use M code to extract unique values:
1. Using List.Distinct Directly in M Code
let
    Source = Excel.CurrentWorkbook(){[Name="YourTable"]}[Content],
    UniqueList = List.Distinct(Source[YourColumn])
in
    UniqueList
This code directly creates a list of unique values from the specified column.
2. Using Table.Group with List.Distinct
let
    Source = Excel.CurrentWorkbook(){[Name="YourTable"]}[Content],
    Grouped = Table.Group(Source, {}, {{"UniqueValues", each List.Distinct(Source[YourColumn])}})
in
    Grouped
This code groups the entire table and creates a new column containing a list of unique values from the specified column.
Practical Examples
Let's consider a practical example where you have a table of customer data with duplicate entries. You want to extract a list of unique customer names.
Original Table:
| CustomerID | CustomerName | OrderDate |
|---|---|---|
| 1 | John Doe | 2025-01-01 |
| 2 | Jane Smith | 2025-01-02 |
| 1 | John Doe | 2025-01-03 |
| 3 | Alice Johnson | 2025-01-04 |
| 2 | Jane Smith | 2025-01-05 |
Using the "Remove Duplicates" feature on the "CustomerName" column, you would get:
Resulting Table:
| CustomerName |
|---|
| John Doe |
| Jane Smith |
| Alice Johnson |
This table contains only the unique customer names, which can be used for further analysis or reporting.
FAQ Section
Q1: How do I handle case sensitivity when extracting unique values?
A: You can use the Text.Lower function to convert all values to lowercase before applying List.Distinct. This ensures that "John" and "john" are treated as the same value.
Q2: Can I extract unique values from a column with blank cells?
A: Yes, Power Query handles blank cells by treating them as distinct values. If you want to exclude blank cells, you can filter them out before extracting unique values.
Q3: How can I improve the performance of extracting unique values from large datasets?
A: For large datasets, using Table.Distinct or List.Distinct is generally more efficient than using the "Group By" transformation. Also, ensure that your data types are correctly set to avoid unnecessary conversions.
Q4: Is it possible to extract unique values based on multiple criteria?
A: Yes, you can use the "Group By" transformation with multiple columns to extract unique combinations of values across those columns.
Q5: How do I convert a list of unique values back into a table?
A: You can use the Table.FromList function to convert a list back into a table. You can also rename the resulting column using Table.RenameColumns.
References
Last updated April 17, 2025