
Unlock the Secrets Within: How Financial Statements Reveal a Company's True Health
Dive deep into the analysis of financial statements to gauge business stability, performance, and potential risks.
Key Insights into Financial Health Analysis
- Informed Decision-Making: Financial statement analysis provides critical quantitative data for investors, creditors, and management to make sound economic decisions regarding investments, lending, and strategic planning.
- Comprehensive Performance Assessment: It involves evaluating liquidity, solvency, profitability, and operational efficiency using tools like ratio analysis and trend analysis across the balance sheet, income statement, and cash flow statement.
- Recognizing Limitations: While powerful, the analysis relies on historical data and doesn't capture qualitative factors or potential accounting manipulations, requiring careful interpretation alongside other business insights.
Introduction: Decoding Company Performance Through Financial Statements
Financial Health Analysis using financial statements is a fundamental process for evaluating a company's financial stability, operational efficiency, and overall economic condition. It involves a systematic examination and interpretation of a firm's primary financial documents: the balance sheet, the income statement, and the cash flow statement. These statements collectively offer a quantitative picture of a company's assets, liabilities, equity, revenues, expenses, profits, and cash movements over specific periods or at a particular point in time. Stakeholders, including investors, creditors, management, and regulators, rely heavily on this analysis to gain insights into a firm's viability, profitability, and associated risks, thereby facilitating informed decision-making.
Visual representation of preparing key financial statements for analysis.
The core idea is to transform raw financial data into meaningful information. This is achieved through various analytical techniques such as:
- Ratio Analysis: Calculating key financial ratios (e.g., liquidity, solvency, profitability, efficiency ratios) to assess different facets of financial health.
- Trend Analysis (Horizontal Analysis): Comparing financial data over multiple periods to identify patterns, growth rates, or areas of concern.
- Common-Size Analysis (Vertical Analysis): Expressing each line item on a financial statement as a percentage of a base figure (e.g., total assets or total revenue) to facilitate comparison, especially between companies of different sizes or across time.
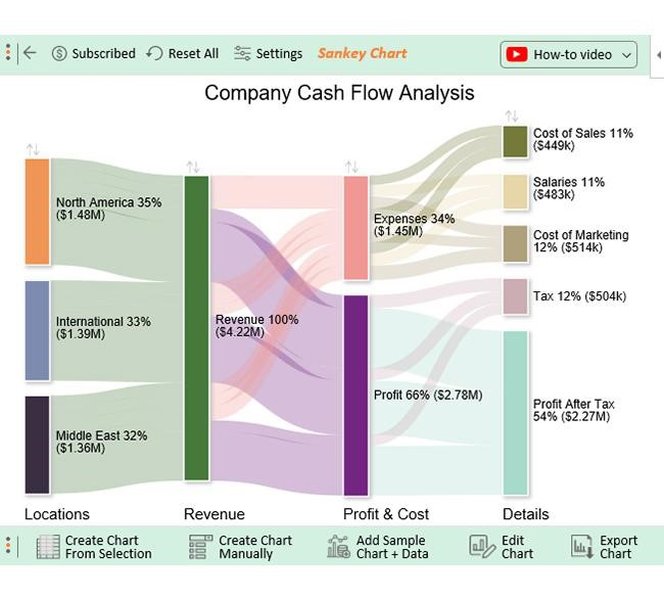
- Cash Flow Evaluation: Analyzing the cash flow statement to understand how a company generates and uses cash, which is crucial for assessing liquidity and operational sustainability.
By employing these methods, analysts can understand a company's ability to meet its short-term obligations (liquidity), manage its long-term debt (solvency), generate earnings (profitability), and utilize its assets effectively (efficiency). This comprehensive evaluation helps paint a picture of the firm's overall financial robustness and its potential for future success.
The Crucial Need for Financial Health Analysis
Conducting a thorough financial health analysis is not merely an academic exercise; it's a critical necessity driven by the practical needs of various stakeholders in today's complex economic environment. As of Friday, 2025-05-02, businesses navigate significant uncertainties like market volatility, inflation, and evolving regulations, making robust financial assessment more vital than ever.
Why is this Analysis Indispensable?
Supporting Investment and Credit Decisions
Investors and potential shareholders need reliable evaluations to determine if investing in a company offers a favorable risk-reward profile. They analyze financial health to gauge profitability, growth potential, and stability before committing capital. Similarly, creditors (like banks and bondholders) scrutinize financial statements to assess a company's creditworthiness and its ability to repay debt obligations. This analysis minimizes lending risks and ensures capital is allocated prudently.
Enhancing Internal Management and Strategic Planning
Company management utilizes financial analysis as a diagnostic tool. It helps identify operational inefficiencies, areas for cost reduction, and opportunities for improving profitability and asset utilization. By understanding the company's financial strengths and weaknesses, managers can make better strategic decisions regarding budgeting, resource allocation, expansion plans, acquisitions, and overall business strategy. It forms the basis for financial planning and forecasting future performance.

An example of an income statement used for financial analysis and forecasting.
Benchmarking and Competitive Positioning
Financial analysis allows companies to compare their performance against industry peers and benchmarks. This comparative analysis helps understand relative strengths, weaknesses, and market positioning. It highlights whether a company is performing above, below, or at par with its competitors, providing context for its financial results.
Ensuring Regulatory Compliance and Transparency
Regular financial analysis helps ensure that companies adhere to accounting standards and regulatory requirements. It promotes transparency and accountability, which is crucial for maintaining stakeholder trust and accessing capital markets.
Detecting Early Warning Signs
Financial health analysis can act as an early warning system, highlighting potential financial distress signals such as deteriorating liquidity, excessive leverage, or declining profitability. Identifying these issues early allows management to take corrective actions before they escalate into crises like insolvency.
Scope of the Study: What Does Financial Health Analysis Cover?
The scope of financial health analysis using financial statements is extensive, covering multiple dimensions of a firm's financial landscape. It primarily revolves around the detailed examination of the three core financial statements:
- The Balance Sheet: Provides a snapshot of a company's assets, liabilities, and shareholders' equity at a specific point in time. Analysis focuses on assessing financial structure, stability, liquidity (e.g., using the current ratio, quick ratio), and solvency (e.g., debt-to-equity ratio).
- The Income Statement (Profit and Loss Statement): Reports a company's financial performance over a period, detailing revenues, expenses, and resulting net income or loss. Analysis here centers on profitability (e.g., gross profit margin, operating profit margin, net profit margin) and operational efficiency.
- The Cash Flow Statement: Tracks the movement of cash and cash equivalents into and out of the company, categorized into operating, investing, and financing activities. This statement is crucial for understanding a company's true liquidity, cash generation capability, and cash management effectiveness.
Beyond analyzing individual statements, the scope typically includes:
- Financial Ratio Analysis: Calculation and interpretation of various ratios across categories like liquidity, solvency, profitability, efficiency, and market value. This is a cornerstone of financial statement analysis.
- Trend Analysis: Evaluating financial data over several consecutive periods (e.g., 3-5 years) to identify trends, growth patterns, and potential red flags.
- Comparative Analysis: Benchmarking the firm's financial metrics against industry averages or key competitors to gauge relative performance.
- Valuation Support: Using financial statement data as inputs for business valuation models (e.g., discounted cash flow, comparable company analysis).
- Risk Assessment: Identifying financial vulnerabilities, such as high debt levels, poor cash flow, or declining margins.
- Stakeholder Relevance: Tailoring the analysis to meet the specific needs of different users, such as investors focusing on ROI and risk, creditors on repayment capacity, and management on operational improvement.
Essentially, the scope encompasses a thorough diagnostic evaluation of a firm's past performance, current financial position, and potential future trajectory based on quantifiable financial data.
Mapping the Landscape of Financial Analysis
To visualize the interconnected components involved in analyzing a firm's financial health using its statements, the following mindmap provides a structured overview. It highlights the core inputs (financial statements), the methods employed, the key objectives pursued, the primary stakeholders involved, and the inherent limitations of the process.
(Assets, Liabilities, Equity)"] id1b["Income Statement
(Revenue, Expenses, Profit)"] id1c["Cash Flow Statement
(Operating, Investing, Financing)"] id1d["Notes to Accounts"] id2["Methods"] id2a["Ratio Analysis
(Liquidity, Solvency, Profitability, Efficiency)"] id2b["Trend Analysis
(Horizontal)"] id2c["Common-Size Analysis
(Vertical)"] id2d["Comparative Analysis
(Industry/Peers)"] id2e["Cash Flow Evaluation"] id3["Objectives"] id3a["Assess Profitability"] id3b["Evaluate Liquidity & Solvency"] id3c["Measure Operational Efficiency"] id3d["Identify Trends & Risks"] id3e["Support Decision Making"] id3f["Facilitate Valuation"] id3g["Benchmark Performance"] id4["Stakeholders"] id4a["Investors & Shareholders"] id4b["Creditors & Lenders"] id4c["Management & Employees"] id4d["Regulators & Government"] id4e["Customers & Suppliers"] id5["Limitations"] id5a["Historical Data Focus"] id5b["Accounting Policy Variations"] id5c["Potential for Manipulation ('Window Dressing')"] id5d["Exclusion of Non-Financial Factors"] id5e["Impact of Inflation"] id5f["Static Snapshots (Balance Sheet)"] id5g["Data Quality & Timeliness"]
This mindmap illustrates how financial statements serve as the foundation for various analytical techniques aimed at achieving specific objectives for different stakeholders, while also acknowledging the constraints inherent in the process.
Objectives: What Does Financial Analysis Aim to Achieve?
The overarching goal of financial health analysis is to provide clear, actionable insights into a company's financial condition and performance. The specific objectives driving this analysis include:
- Assess Overall Financial Condition: To provide a holistic view of the company's financial stability and viability by examining its balance sheet structure, debt levels, and equity base.
- Evaluate Liquidity Position: To determine the company's ability to meet its short-term financial obligations as they come due, primarily by analyzing current assets and liabilities and cash flow from operations.
- Measure Solvency (Long-Term Stability): To assess the company's capacity to meet its long-term debt obligations and sustain operations over the long haul, often involving analysis of leverage ratios like the debt-to-equity ratio.
- Analyze Profitability: To understand how effectively the company generates profits from its sales and operations, using metrics like gross profit margin, operating profit margin, net profit margin, and return on equity (ROE).
- Study Operational Efficiency: To evaluate how efficiently the company utilizes its assets and manages its liabilities and expenses in day-to-day operations, often measured through turnover ratios (e.g., asset turnover, inventory turnover) and expense control.
- Identify Financial Trends and Patterns: To spot significant trends in revenues, costs, profits, cash flows, and key ratios over multiple accounting periods, helping in forecasting future performance.
- Provide Basis for Informed Decisions: To equip stakeholders (investors, creditors, managers) with the necessary financial intelligence to make sound decisions regarding investments, lending, strategic direction, and resource allocation.
- Highlight Strengths and Weaknesses: To pinpoint areas where the company excels financially and areas requiring attention or improvement, aiding in strategic planning and risk management.
- Facilitate Comparative Analysis: To enable meaningful comparisons of the company's financial performance and position against its competitors and industry benchmarks.
- Estimate Intrinsic Value: To provide inputs for valuation models used to estimate the fair value of the company or its securities.
- Assess Financial Risks: To identify potential financial risks, such as high leverage, poor liquidity, or inconsistent profitability, and potentially suggest mitigation strategies.
Key Financial Ratios: A Snapshot
Financial ratios are the workhorse tools of financial statement analysis. They provide standardized measures that facilitate comparisons over time and across companies. Below is a table summarizing some common categories and examples of financial ratios:
| Ratio Category | Example Ratio | Formula | Purpose |
|---|---|---|---|
| Liquidity Ratios | Current Ratio | \( \frac{\text{Current Assets}}{\text{Current Liabilities}} \) | Measures ability to pay short-term obligations. |
| Quick Ratio (Acid-Test) | \( \frac{\text{Current Assets} - \text{Inventory}}{\text{Current Liabilities}} \) | Measures ability to pay short-term obligations without relying on inventory sales. | |
| Solvency Ratios (Leverage) | Debt-to-Equity Ratio | \( \frac{\text{Total Debt}}{\text{Total Equity}} \) | Indicates the proportion of debt financing relative to equity financing; measures financial risk. |
| Interest Coverage Ratio | \( \frac{\text{EBIT}}{\text{Interest Expense}} \) | Measures ability to cover interest payments with operating earnings (EBIT: Earnings Before Interest and Taxes). | |
| Profitability Ratios | Net Profit Margin | \( \frac{\text{Net Income}}{\text{Total Revenue}} \times 100\% \) | Measures the percentage of revenue remaining as profit after all expenses. |
| Return on Equity (ROE) | \( \frac{\text{Net Income}}{\text{Average Shareholders' Equity}} \times 100\% \) | Measures the return generated on shareholders' investment. | |
| Return on Assets (ROA) | \( \frac{\text{Net Income}}{\text{Average Total Assets}} \times 100\% \) | Measures how efficiently assets are used to generate profit. | |
| Efficiency Ratios (Activity/Turnover) | Asset Turnover Ratio | \( \frac{\text{Total Revenue}}{\text{Average Total Assets}} \) | Measures how efficiently assets are used to generate revenue. |
| Inventory Turnover Ratio | \( \frac{\text{Cost of Goods Sold}}{\text{Average Inventory}} \) | Measures how quickly inventory is sold. | |
| Market Value Ratios | Price-to-Earnings (P/E) Ratio | \( \frac{\text{Market Price per Share}}{\text{Earnings per Share (EPS)}} \) | Indicates market expectation of future earnings growth; relates share price to earnings. |
This table provides a glimpse into the types of calculations performed during financial analysis. Interpreting these ratios in context – considering industry norms, historical trends, and company specifics – is crucial for drawing meaningful conclusions.
Visualizing Key Financial Health Dimensions
The radar chart below offers a conceptual visualization of how a hypothetical company might perform across several key dimensions of financial health analysis. It compares the company's assessed strength (on a scale, for illustrative purposes) in areas like Liquidity, Solvency, Profitability, Operational Efficiency, Cash Flow Strength, and Growth Potential against a benchmark or desired level. Such visualizations can help quickly identify areas of relative strength and weakness.
In this example, Company A shows stronger Profitability and Data Reliability compared to the benchmark but might need to improve Solvency and Cash Flow Strength. This kind of comparative view helps prioritize areas for deeper investigation or strategic focus.
Understanding the Limitations: A Reality Check
While indispensable, financial statement analysis is not a perfect science and possesses inherent limitations that users must acknowledge for a balanced perspective:
- Reliance on Historical Data: Financial statements report past events and results. While trends can be informative, past performance is not always a reliable predictor of future outcomes, especially in rapidly changing markets or industries.
- Differences in Accounting Methods and Estimates: Companies can choose between different acceptable accounting principles (e.g., inventory valuation methods like FIFO vs. LIFO, depreciation methods). These choices, along with management estimates (e.g., bad debt provisions, asset useful lives), can significantly impact reported figures and hinder direct comparability between firms.
- Potential for "Window Dressing" and Manipulation: Management might engage in practices to make financial statements appear more favorable than they truly are, particularly around reporting periods. This can involve timing transactions, altering assumptions, or even outright fraud, distorting the true financial picture.
- Exclusion of Non-Financial Factors: Financial statements primarily capture quantifiable monetary transactions. They typically don't reflect crucial qualitative aspects like management quality, employee morale, brand reputation, customer satisfaction, technological innovation, competitive landscape, or broader economic/political factors, all of which significantly impact a company's long-term health and value.
- Impact of Inflation and Price Level Changes: Traditional financial statements are based on historical costs and do not always adjust for inflation. This can distort the true value of assets and liabilities and affect the comparability of financial data across different time periods, especially during high inflation.
- Static Nature of the Balance Sheet: The balance sheet represents a company's financial position at a single point in time. It might not reflect the company's situation accurately just before or after that date, as positions can change rapidly.
- Lack of Detail and Aggregation: Financial statements often present aggregated data. This might obscure important details about specific product lines, geographic segments, or operational issues that could be critical for a thorough analysis.
- Data Timeliness and Availability: Financial statements are typically released quarterly or annually, meaning the information might be outdated by the time it becomes available for analysis, especially for dynamic businesses.
- Industry-Specific Nuances: Financial ratios and metrics can have vastly different interpretations and benchmarks across different industries. Applying generic benchmarks without understanding industry specifics can lead to incorrect conclusions.
Awareness of these limitations is crucial. Financial statement analysis should ideally be complemented with qualitative assessments, industry knowledge, and economic outlooks for a more comprehensive and reliable evaluation of a firm's health.
Learning More: Assessing a Company's Financial Health
Understanding how to practically analyze financial statements is key for investors and analysts. The following video provides insights into evaluating a company's financial position by examining its core financial documents. It explains what key indicators to look for in balance sheets, income statements, and cash flow statements to assess overall financial well-being.
This video serves as a practical guide, demonstrating how analyzing these statements reveals crucial information about a company's ability to manage assets, control liabilities, generate profits, and maintain healthy cash flows—essential components of financial health assessment.
Frequently Asked Questions (FAQ)
What are the three main financial statements used in analysis?
The three primary financial statements are:
- Balance Sheet: Shows a company's assets, liabilities, and equity at a specific point in time.
- Income Statement: Reports revenues, expenses, and profit over a specific period.
- Cash Flow Statement: Tracks cash inflows and outflows from operating, investing, and financing activities over a period.
Who uses financial health analysis?
A wide range of stakeholders use financial health analysis, including:
- Investors: To decide whether to buy, hold, or sell shares.
- Creditors/Lenders: To assess creditworthiness and loan repayment ability.
- Management: To evaluate performance, make strategic decisions, and improve operations.
- Regulators: To ensure compliance with financial reporting standards.
- Competitors: To benchmark their own performance.
- Suppliers/Customers: To assess the financial stability of business partners.
Can financial statement analysis predict a company's future?
Financial statement analysis primarily uses historical data, so it cannot predict the future with certainty. However, analyzing trends, ratios, and cash flows can provide valuable insights into a company's potential future performance and risks. It helps in making educated forecasts, but these should always be considered alongside qualitative factors, industry trends, and economic conditions.
What is the difference between liquidity and solvency?
Liquidity refers to a company's ability to meet its short-term obligations (typically those due within one year) using its current assets. It focuses on immediate financial health.
Solvency refers to a company's ability to meet its long-term financial obligations and continue operations indefinitely. It focuses on long-term financial stability and the company's capital structure (mix of debt and equity).
Recommended Further Exploration
- How do specific financial ratios indicate company performance?
- What are the differences in financial analysis across various industries?
- How can investors detect potential accounting manipulation in financial statements?
- What role does cash flow analysis play in evaluating a firm's financial health?
References
Last updated May 2, 2025