
Unlocking Forex Profits: Your Detailed Guide to Finding High-Impact Key Levels
Master the art of identifying crucial price points on GBPUSD & EURUSD, starting with your daily chart analysis.
Understanding how to identify Points of Interest (POI) and Key Levels (K.L.) is a cornerstone of successful Forex trading. These are specific price areas where significant market reactions—like bounces, breakouts, or reversals—are anticipated. For traders focusing on pairs like GBPUSD ("The Cable") and EURUSD, a systematic approach to finding these levels, especially at the start of the trading day, can provide a crucial edge. Let's explore how you can refine this process, incorporating your morning routine of checking news, assessing market structure, and focusing on the previous candle.
Essential Takeaways: Mastering Key Level Identification
- Systematic Preparation is Paramount: Always begin your trading day by checking fundamental news and clearly identifying the prevailing market structure (e.g., bullish, bearish, or ranging) before diving into chart analysis.
- The Previous Candle as an Immediate Clue: The high, low, open, and close of the previous candle(s) offer critical immediate insights into potential short-term support and resistance areas, especially when aligned with the broader market structure.
- Confirmation Through Multiple Techniques: The most robust key levels are often those identified and confirmed through a confluence of different analytical methods, including historical price action, psychological numbers, and technical indicators.
Your Morning Ritual: A Step-by-Step Guide to Finding Key Levels
You described a common and effective routine: wake up, grab your coffee, and prepare for the trading day with a set of mechanical rules. The goal is to find the *best* key level. Here’s a detailed breakdown of that process:
Step 1: The Pre-Chart Warm-up: Fundamental News
Before you even glance at a price chart, understanding the fundamental landscape is crucial. Economic data releases, central bank statements, geopolitical events, and unscheduled news can significantly impact currency valuations and volatility.
Why it Matters:
Fundamental news provides context. A strong piece of economic data can reinforce an existing trend or trigger a reversal, making certain price levels more or less significant. For example, unexpectedly positive UK employment data might strengthen a bullish bias on GBPUSD, making potential support levels more likely to hold.
Practical Application:
Utilize an economic calendar to be aware of scheduled high-impact news for the currencies you're trading (e.g., GBP, USD, EUR). Note the timing of these releases and consider avoiding placing new trades immediately before or after, as volatility can be unpredictable. For instance, on May 9, 2025, check for any overnight developments or upcoming announcements from the Bank of England, the Federal Reserve, or the European Central Bank.
Step 2: Setting the Scene: Identifying Market Structure
Once you have a grasp of the fundamental backdrop, your next step is to identify the market structure. As you mentioned, sometimes it's "obvious," like a clear bullish trend. Market structure refers to the current directional bias of the market:
- Bullish (Uptrend): Characterized by a series of higher highs and higher lows.
- Bearish (Downtrend): Characterized by a series of lower highs and lower lows.
- Ranging (Sideways): Price oscillates between a definable support and resistance level, without a clear directional trend.
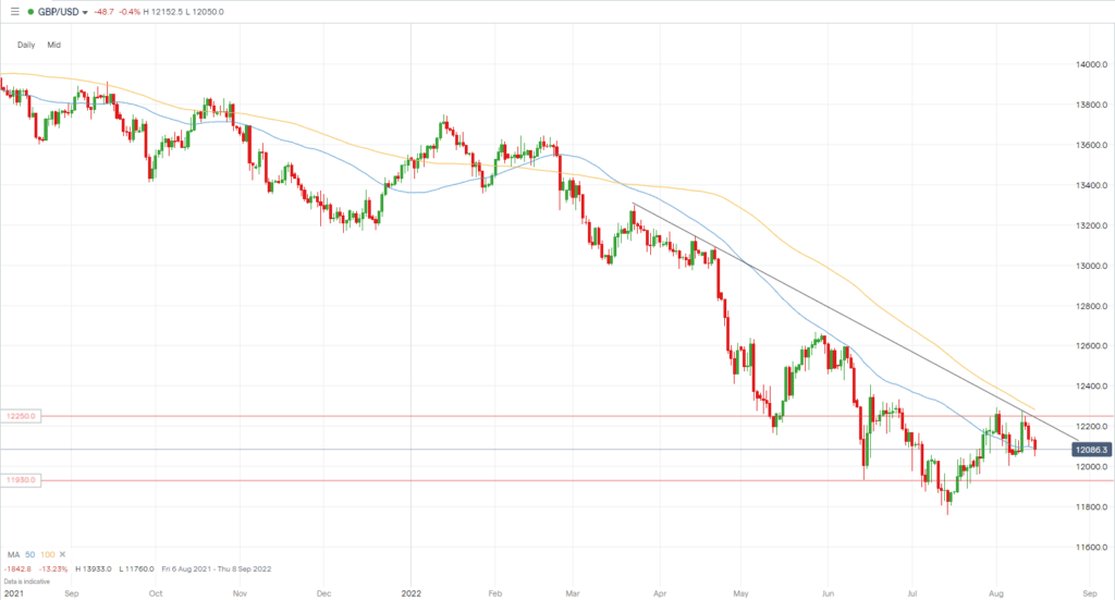
Illustrative GBPUSD chart highlighting potential market structure analysis.
Why it Matters:
The prevailing market structure dictates how you interpret key levels. In a bullish structure on GBPUSD, you'd primarily look for key levels to act as support for potential buying opportunities. Conversely, in a bearish structure, you'd look for resistance levels for potential selling opportunities.
Practical Application:
Scan higher timeframes (like the 4-hour or daily chart) to establish the dominant trend. Look for the patterns of highs and lows. For your GBPUSD example, if it's in a bullish structure, you'd note the recent swing lows as potential areas where buying interest previously overcame selling pressure.
Step 3: The Focal Point: Analyzing the Previous Candle for Initial Clues
With the fundamental context and market structure established, you then "look for the previous candle." This is a critical step for identifying immediate, highly relevant potential key levels.
Why it Matters:
The most recent price action, encapsulated by the previous one or few candles (depending on your trading timeframe), reflects the latest battle between buyers and sellers. The high, low, open, and close of these candles are significant short-term reference points.
Practical Application:
On your chosen trading timeframe (e.g., 1-hour, 4-hour):
- Previous Candle Low: In a bullish structure, the low of the previous candle can act as immediate support. If price respects this level, it suggests buyers are still in control.
- Previous Candle High: In a bearish structure, the high of the previous candle can act as immediate resistance.
- Previous Candle Close: The closing price is often considered very important as it represents the final agreed-upon price for that period.
- Wicks (Shadows): Long wicks indicate areas where price attempted to move but was rejected, highlighting potential supply or demand. For instance, a long lower wick on the previous candle in a bullish GBPUSD market structure suggests buyers stepped in to defend a certain price level.
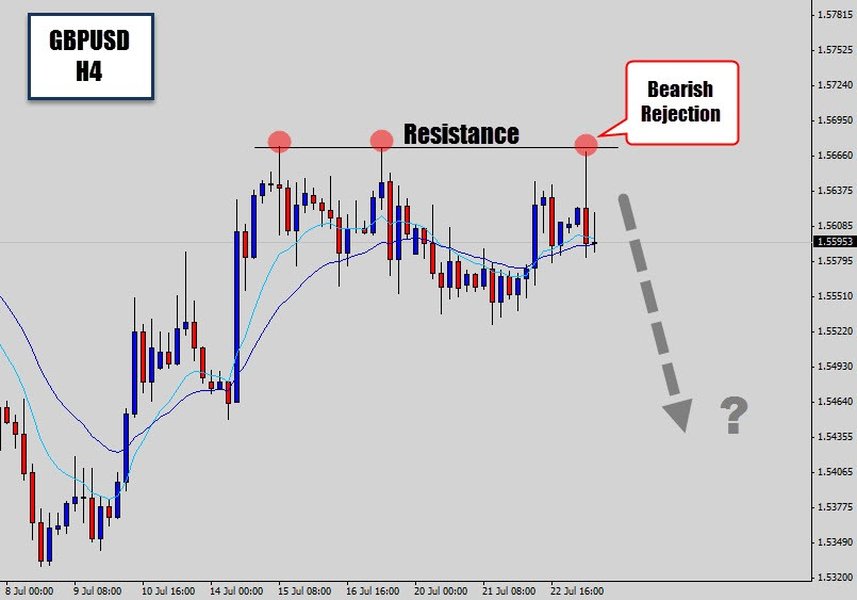
Example of GBPUSD 4-hour chart; note how previous candle highs/lows can provide clues.
Beyond the Previous Candle: Comprehensive Techniques for Pinpointing Key Levels
While the previous candle provides immediate clues, robust key level identification involves a broader analysis. These "best" key levels often represent a confluence of factors.
Reading History: Price Action Analysis
The market has a memory. Levels where price has reacted significantly in the past are likely to be respected again.
Swing Highs and Lows:
These are the peaks and troughs in price movement. A previous swing high can act as resistance, while a previous swing low can act as support. The more times a swing point has been tested and held, the stronger it is considered.
Repeated Test Zones (Support and Resistance):
Look for price levels or zones where the market has stalled or reversed multiple times. These are classic support (floor) and resistance (ceiling) levels. Drawing horizontal lines at these areas on your chart makes them easy to monitor.
The Power of Numbers: Quantitative & Psychological Levels
Certain numerical levels inherently attract traders' attention.
Round Numbers (Psychological Levels):
Prices like 1.2000, 1.2500, or 1.3000 for GBPUSD, or 1.0800, 1.1000 for EURUSD, often act as psychological barriers. Traders tend to place orders around these levels, creating self-fulfilling prophecies of support or resistance.
Fibonacci Retracement Levels:
Derived from the Fibonacci sequence, these levels (commonly 38.2%, 50%, and 61.8%) are used to identify potential reversal points after a significant price move. If a Fibonacci level aligns with a historical support/resistance level or a previous candle's key point, its significance increases.
Pivot Points:
Calculated using the previous trading period's high, low, and close prices (often daily pivots), these provide pre-defined levels of potential support and resistance for the current trading session. Many institutional traders watch these levels.
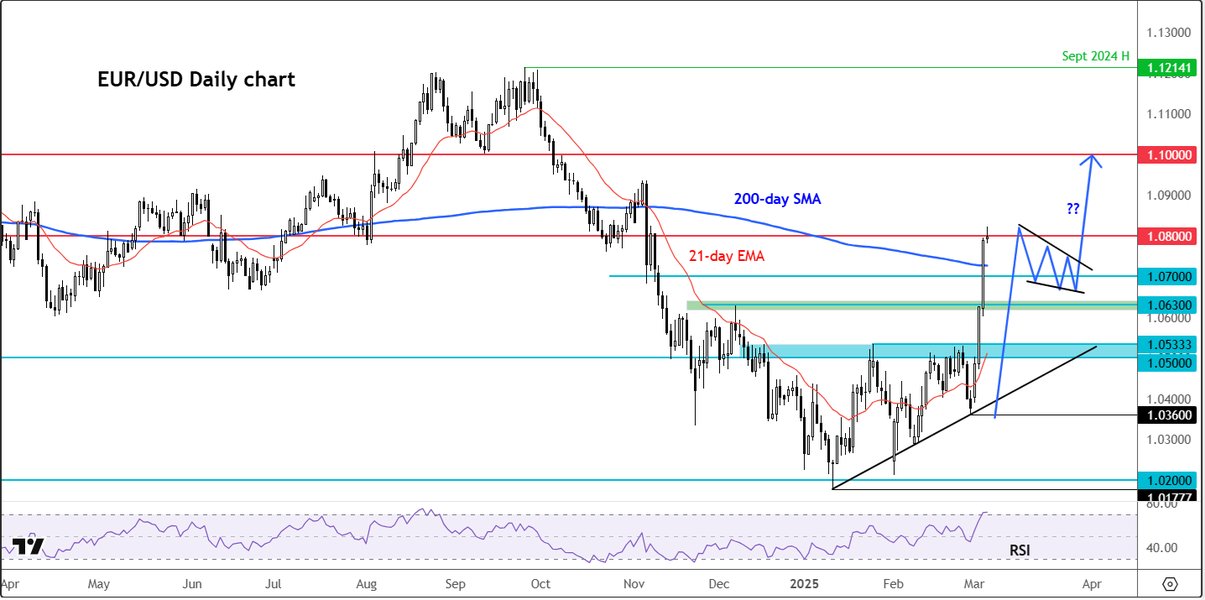
EURUSD chart showing price action, where traders might identify key levels.
Quickly Check EURUSD for Confirmation
Sometimes, observing correlated pairs like EURUSD can offer additional insight. If both GBPUSD and EURUSD (which often have a positive correlation due to the USD component and European economic ties) are showing similar reactions at their respective key levels or similar market structures, it can add a degree of confidence to your analysis for GBPUSD.
Visualizing Key Level Strength
Not all key levels are created equal. The strength of a key level can be conceptually understood by considering various contributing factors. The radar chart below illustrates how different elements can combine to define the potential impact of a key level. A "Strong Key Level" would ideally score high across multiple factors, such as strong historical precedent, recent validation by price action, confirmation by volume, alignment with the dominant trend, and psychological significance.
This chart helps conceptualize that a key level gains strength from multiple agreeing factors. For example, a round number that was also a previous swing low, aligns with a 61.8% Fibonacci retracement, and saw significant volume on its last test, would be considered a very strong key level.
Connecting the Dots: A Mindmap of Key Level Identification
To provide a holistic overview, the following mindmap illustrates the interconnected elements involved in identifying and utilizing key levels in your Forex trading strategy. It starts with your daily preparation and branches out into the various analytical techniques and considerations discussed.
(Economic Calendar, Geopolitics)"] id1b["Determine Market Structure
(Bullish, Bearish, Ranging)"] id1c["Focus on Previous Candle(s)
(High, Low, Close, Wicks)"] id2["Core Key Level Identification Techniques"] id2a["Price Action Analysis"] id2a1["Historical Support & Resistance
(Repeated Test Zones)"] id2a2["Swing Highs & Lows"] id2a3["Candlestick Patterns at Levels"] id2b["Quantitative & Psychological Levels"] id2b1["Round Numbers (e.g., 1.2500)"] id2b2["Fibonacci Retracements & Extensions"] id2b3["Pivot Points (Daily, Weekly)"] id2c["Volume Analysis
(Confirmation of Level Strength)"] id2d["Trend Lines & Channels"] id3["Tools & Indicators"] id3a["Charting Software (e.g., TradingView)"] id3b["Horizontal Line Tool"] id3c["Fibonacci Tool"] id3d["Pivot Point Calculators/Indicators"] id4["Trading with Key Levels"] id4a["Entry Points (e.g., Bounce or Breakout)"] id4b["Exit Points (Take Profit Targets)"] id4c["Stop Loss Placement"] id4d["Risk Management"] id4e["Applying Mechanical Rules"] id5["Contextual Factors"] id5a["Timeframe Analysis (Higher TF for major levels)"] id5b["Currency Pair Specifics (e.g., GBPUSD, EURUSD)"] id5c["Correlation Check (e.g., EURUSD for GBPUSD)"] id5d["Market Psychology (Herd Behavior)"]
This mindmap provides a structured way to think about the process, from your initial daily steps to the deeper analytical techniques and how they feed into your trading decisions.
Practical Application: Methods for GBPUSD & EURUSD
The following table summarizes common methods for identifying key levels, with specific considerations for pairs like GBPUSD and EURUSD. Remember, confluence—where multiple methods point to the same level—often indicates a stronger key level.
| Method | Description | Example (GBPUSD/EURUSD) | Pros | Cons |
|---|---|---|---|---|
| Previous Candle Analysis | Using the high, low, open, close of recent candles as immediate support/resistance. | GBPUSD bullish: Previous day's low at 1.2720 acts as initial support. | Highly relevant, immediate. | Can be short-term; needs confirmation. |
| Horizontal Lines (Swing Points) | Drawing lines at significant past highs (resistance) and lows (support). | EURUSD repeatedly bounced off 1.0750; mark as support. | Clear visual, historically significant. | Subjective placement; markets evolve. |
| Round Numbers | Psychologically important levels ending in .00 or .50. | GBPUSD approaching 1.3000, a known psychological resistance. | Often respected due to order clustering. | Can be front-run or slightly breached. |
| Fibonacci Retracement | Identifying potential reversal areas after a trend move (e.g., 50%, 61.8%). | After a GBPUSD rally, price retraces to the 61.8% level which aligns with a previous low. | Objective, widely used. | Requires a clear swing to draw from; multiple levels can be confusing. |
| Pivot Points | Daily calculated levels based on previous day's HLC. | EURUSD approaching the daily R1 (first resistance) pivot point. | Objective, used by many traders. | Mainly for intraday; less effective in strong trends. |
Video Guide: Visual Learning for Key Level Identification
To further enhance your understanding, watching how experienced traders identify key levels can be very beneficial. The video below offers insights into recognizing significant areas on a chart. While the specific examples may differ, the underlying principles of identifying support, resistance, and areas of interest are universally applicable.
This video, "How To Identify Key levels - Areas/Levels To Trade From," provides a visual demonstration of spotting crucial price zones.
The presenter discusses how to easily identify key levels that can complement various trading strategies. Key concepts often involve looking for areas where price has reacted strongly in the past, forming clear support or resistance. These are the zones where you might anticipate future market reactions, aligning with your goal of finding the "best" key levels for your trades on pairs like GBPUSD or EURUSD.
Frequently Asked Questions (FAQ)
Recommended Further Exploration
- How does market psychology influence reactions at key Forex levels?
- What are the best strategies for trading breakouts and bounces from key levels on GBPUSD?
- How can I effectively combine Fibonacci retracements with previous candle analysis to find entry points?
- What role does volume analysis play in confirming the strength of key support and resistance levels?
References
Last updated May 9, 2025