
Comprehensive Guide to Probability and Statistics for GATE Exam
Mastering Core Concepts to Ace Your GATE Probability and Statistics Section
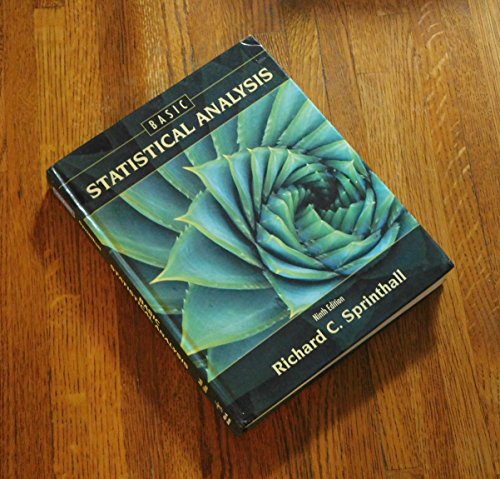
Key Takeaways
- Fundamental Concepts: Understanding counting techniques, probability axioms, and various types of probabilities is essential for solving complex problems.
- Statistical Measures and Distributions: Grasping measures of central tendency, dispersion, and different probability distributions aids in data analysis and interpretation.
- Inferential Statistics: Mastery of the Central Limit Theorem, confidence intervals, and hypothesis testing methods like z-test, t-test, and chi-squared tests is crucial for making informed decisions based on data.
1. Counting Techniques
Permutations and Combinations
Counting techniques are foundational in probability, enabling the determination of the number of possible outcomes in various scenarios.
Permutations
Permutations refer to the arrangement of objects where the order matters. The number of ways to arrange n distinct objects is given by n! (n factorial).
Formula: P(n, r) = n! / (n – r)!
Example: The number of ways to arrange 3 objects out of 5 is P(5, 3) = 5! / (5-3)! = 60.
Combinations
Combinations involve selecting objects where the order does not matter.
Formula: C(n, r) = n! / (r! (n – r)!)
Example: The number of ways to choose 2 objects out of 4 is C(4, 2) = 6.
2. Probability Axioms
Fundamental Rules of Probability
The probability axioms form the basic rules that define how probabilities are assigned to events.
First Axiom: Non-negativity
The probability of any event is always non-negative.
Mathematically: P(E) ≥ 0 for any event E.
Second Axiom: Normalization
The probability of the entire sample space is 1.
Mathematically: P(S) = 1.
Third Axiom: Additivity
The probability of the union of mutually exclusive events is the sum of their individual probabilities.
Mathematically: If E₁, E₂, …, Eₙ are mutually exclusive, then P(E₁ ∪ E₂ ∪ … ∪ Eₙ) = P(E₁) + P(E₂) + … + P(Eₙ).
3. Sample Space and Events
Defining Possible Outcomes
Sample Space (S)
The sample space is the set of all possible outcomes of a random experiment.
Example: For a coin toss, S = {Heads, Tails}.
Events
An event is a subset of the sample space representing one or more outcomes.
Example: Getting a Head in a coin toss is an event: E = {Heads}.
4. Types of Events
Independent and Mutually Exclusive Events
Independent Events
Two events are independent if the occurrence of one does not affect the probability of the other.
Mathematically: P(A ∩ B) = P(A) × P(B).
Mutually Exclusive Events
Two events are mutually exclusive (disjoint) if they cannot occur simultaneously.
Mathematically: P(A ∩ B) = 0.
5. Probability Types
Marginal, Conditional, and Joint Probability
Marginal Probability
The probability of a single event occurring without considering other events.
Example: P(A).
Conditional Probability
The probability of an event occurring given that another event has occurred.
Formula: P(A|B) = P(A ∩ B) / P(B), provided P(B) > 0.
Joint Probability
The probability of two or more events occurring together.
Example: P(A ∩ B).
6. Bayes' Theorem
Updating Probabilities with New Evidence
Bayes' Theorem allows the revision of existing probabilities based on new information.
Formula: P(A|B) = [P(B|A) × P(A)] / P(B).
Application: Often used in diagnostic testing and decision making under uncertainty.
7. Conditional Expectation and Variance
Expectation and Variance Given Conditions
Conditional Expectation
The expected value of a random variable given that another variable or event is known.
Notation: E[X|Y].
Conditional Variance
The variance of a random variable given that another variable or event is known.
Notation: Var(X|Y).
8. Measures of Central Tendency and Dispersion
Understanding Data Distribution
Mean
The average value of a dataset. It is calculated as the sum of all values divided by the number of values.
Formula: E[X] = Σ x · P(x) for discrete variables or ∫ x·f(x)dx for continuous variables.
Median
The middle value in an ordered dataset, separating the higher half from the lower half.
Mode
The most frequently occurring value in a dataset.
Standard Deviation
A measure of the amount of variation or dispersion in a set of values.
Formula: σ = √Var(X).
Correlation and Covariance
Covariance: Measures how two random variables change together.
Formula: Cov(X, Y) = E[(X – E[X])(Y – E[Y])].
Correlation: A standardized measure of the linear relationship between two variables, ranging from -1 to 1.
Formula: ρ(X, Y) = Cov(X, Y) / (σX · σY).
9. Random Variables
Discrete and Continuous Variables
Discrete Random Variables
Variables that take on a countable number of distinct values.
Example: Number of heads in coin tosses.
Continuous Random Variables
Variables that can take any value within a given range.
Example: Heights of individuals.
10. Probability Mass Functions and PDFs
Describing Probabilities
Probability Mass Function (PMF)
For discrete random variables, the PMF gives the probability that a random variable is exactly equal to some value.
Formula: P(X = x).
Probability Distribution Function (PDF)
For continuous random variables, the PDF describes the likelihood of the random variable taking on a particular value.
Formula: f(x).
Relationship with CDF: P(a ≤ X ≤ b) = ∫ab f(x) dx.
11. Common Probability Distributions
Discrete and Continuous Distributions
Discrete Distributions
- Uniform Distribution: Each outcome has an equal probability.
- Bernoulli Distribution: Models a single trial with two outcomes (success/failure).
- Binomial Distribution: Represents the number of successes in a fixed number of independent Bernoulli trials.
Continuous Distributions
-
Uniform Distribution: Constant probability density within a given interval.
-
Exponential Distribution: Models the time between events in a Poisson process.
-
Poisson Distribution: Models the number of events in a fixed interval of time or space.
-
Normal Distribution: Bell-shaped curve, symmetric about the mean.
-
Standard Normal Distribution: A normal distribution with mean 0 and standard deviation 1.
-
t-Distribution: Used when the sample size is small and the population standard deviation is unknown.
-
Chi-Squared Distribution: Used in hypothesis testing and confidence interval estimation for variances.
12. Cumulative Distribution Function (CDF) and Conditional PDF
Understanding Probability Accumulation
Cumulative Distribution Function (CDF)
The CDF of a random variable X, denoted as F(x), is the probability that X will take a value less than or equal to x.
Formula: F(x) = P(X ≤ x).
Conditional Probability Density Function (PDF)
The PDF of a random variable X given another variable Y = y, denoted as fX|Y(x|y), is defined as:
Formula: fX|Y(x|y) = fX,Y(x, y) / fY(y), provided fY(y) > 0.
13. Central Limit Theorem (CLT)
Foundation of Inferential Statistics
The Central Limit Theorem states that the distribution of the sample mean approaches a normal distribution as the sample size becomes large, regardless of the original distribution of the population.
Mathematically: If X₁, X₂, ..., Xₙ are independent and identically distributed random variables with mean μ and variance σ², then the standardized sum:
$$ Z = \frac{\sum_{i=1}^{n} X_i - n\mu}{\sigma\sqrt{n}} \rightarrow \mathcal{N}(0,1) \text{ as } n \rightarrow \infty. $$
Implications: The CLT justifies the use of normal distribution approximations in various statistical methods, such as confidence intervals and hypothesis testing.
14. Confidence Intervals and Hypothesis Testing
Making Inferences from Data
Confidence Interval
A confidence interval is a range of values, derived from sample data, that is likely to contain the true population parameter with a specified level of confidence (e.g., 95%).
General Form: \(\bar{X} \pm (Z \text{ or } t) \times \frac{\sigma}{\sqrt{n}}\)
Z-Test
Used when the population standard deviation is known or the sample size is large.
Test Statistic: \( Z = \frac{\bar{X} - \mu_0}{\sigma / \sqrt{n}} \)
T-Test
Used when the population standard deviation is unknown and the sample size is small.
Test Statistic: \( t = \frac{\bar{X} - \mu_0}{s / \sqrt{n}} \) with \( n-1 \) degrees of freedom.
Chi-Squared Test
Used for hypothesis testing about categorical data or variances.
Applications: Goodness-of-fit tests, test of independence in contingency tables.
Test Statistic: \( \chi^2 = \sum \frac{(O_i - E_i)^2}{E_i} \)
15. Summary Table of Distributions
| Distribution | Type | Parameters | Mean | Variance | Support |
|---|---|---|---|---|---|
| Uniform | Discrete & Continuous | For discrete: n; For continuous: a, b | For discrete: (n+1)/2; For continuous: (a+b)/2 | For discrete: (n² -1)/12; For continuous: (b - a)² / 12 | Discrete: {1, 2, ..., n}; Continuous: [a, b] |
| Bernoulli | Discrete | p | p | p(1-p) | {0, 1} |
| Binomial | Discrete | n, p | np | np(1-p) | {0, 1, ..., n} |
| Exponential | Continuous | λ | 1/λ | 1/λ² | [0, ∞) |
| Poisson | Discrete | λ | λ | λ | {0, 1, 2, ...} |
| Normal | Continuous | μ, σ² | μ | σ² | (-∞, ∞) |
| Standard Normal | Continuous | μ = 0, σ² = 1 | 0 | 1 | (-∞, ∞) |
| t-Distribution | Continuous | Degrees of freedom (df) | 0 | df / (df - 2) | (-∞, ∞) |
| Chi-Squared | Continuous | Degrees of freedom (df) | df | 2df | [0, ∞) |
16. Conclusion
Final Thoughts for GATE Preparation
Mastering Probability and Statistics is pivotal for excelling in the GATE exam. A deep understanding of counting techniques, various probability measures, statistical distributions, and inferential methods equips you with the tools necessary to tackle complex problems confidently. Regular practice with previous GATE questions, coupled with a solid grasp of underlying theories, will significantly enhance your performance in this section.
References
Last updated February 12, 2025