
GDP: The Global Economic Yardstick – Accurate Measure or Flawed Comparison Tool?
Unpacking the advantages and disadvantages of using Gross Domestic Product to rank national economic performance.
Gross Domestic Product (GDP) is arguably the most widely recognized metric for assessing and comparing the economic performance of countries. It represents the total monetary or market value of all the finished goods and services produced within a country's borders in a specific time period, usually a year. While its prevalence offers a common language for economic dialogue, its utility and limitations in intercountry comparisons are subjects of ongoing debate. Understanding these nuances is crucial for policymakers, economists, investors, and citizens alike.
Key Insights: GDP as a Comparative Tool
- Standardization & Availability: GDP provides a standardized methodology for measuring economic output, with data widely available from international organizations, facilitating straightforward cross-country comparisons.
- Incomplete Picture of Well-being: A major drawback is GDP's failure to capture crucial aspects like income inequality, non-market activities (e.g., volunteer work), environmental degradation, and overall quality of life.
- Adjustments for Nuance: Metrics like GDP per capita (GDP divided by population) and GDP adjusted for Purchasing Power Parity (PPP) offer more refined comparisons by accounting for population size and differences in living costs, respectively.
The Upsides: Why GDP is Widely Used for Intercountry Comparisons
Despite criticisms, GDP possesses several characteristics that have cemented its role as a primary indicator for comparing economic performance across nations.
Standardized and Widely Recognized Framework
A Common Economic Language
One of the foremost advantages of GDP is its widespread adoption and the standardized methodologies used in its calculation, often guided by international bodies like the IMF and World Bank. This consistency allows for direct comparisons of economic output between different countries. Whether using the income approach (summing all earnings) or the expenditure approach (summing all spending), the resulting figure provides a quantifiable measure that is globally understood. This makes GDP data relatively "cheap and easy to collect" and readily available, enabling quick assessments of relative economic strength and growth trajectories.
Indicator of Economic Size and Growth
Gauging Economic Output
GDP offers a clear snapshot of the overall scale of a country's economy. Nominal GDP reflects the current market value, while Real GDP (adjusted for inflation) provides a more accurate measure of growth in economic output over time and between countries by factoring out price changes. This allows analysts to track economic trends, compare growth rates (e.g., emerging vs. advanced economies), and assess the relative economic power of nations. For instance, observing percentage growth in real GDP helps to understand which economies are expanding more rapidly.
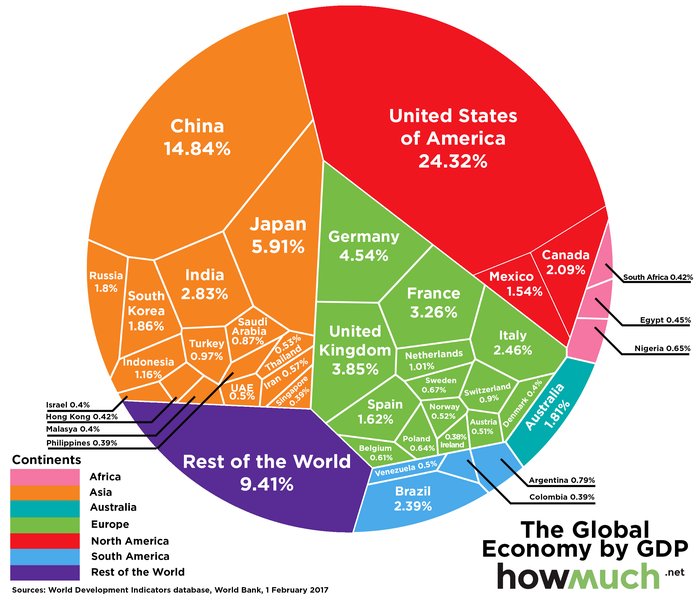
A visualization of global GDP distribution, highlighting the economic output of various countries.
Utility in Policy-Making and Investment
Guiding Economic Strategies
Governments and international organizations rely on GDP figures to inform economic policies, allocate resources, and set development goals. A growing GDP is often associated with positive outcomes like increased employment, higher incomes, and greater capacity for public spending on services like healthcare and education. Similarly, investors use GDP data and growth forecasts to make decisions about where to allocate capital, with countries showing strong GDP growth often attracting more foreign investment. The transparency offered by GDP figures regarding government spending and investment levels can also be compared internationally.
Facilitating Per Capita Comparisons
Adjusting for Population
While total GDP indicates the size of an economy, GDP per capita (total GDP divided by the population) provides a measure of average economic output per person. This adjustment is crucial for more meaningful comparisons of living standards and economic productivity between countries with vastly different population sizes. For example, a country with a large population might have a high total GDP but a low GDP per capita, suggesting lower average individual prosperity compared to a smaller, wealthier nation.
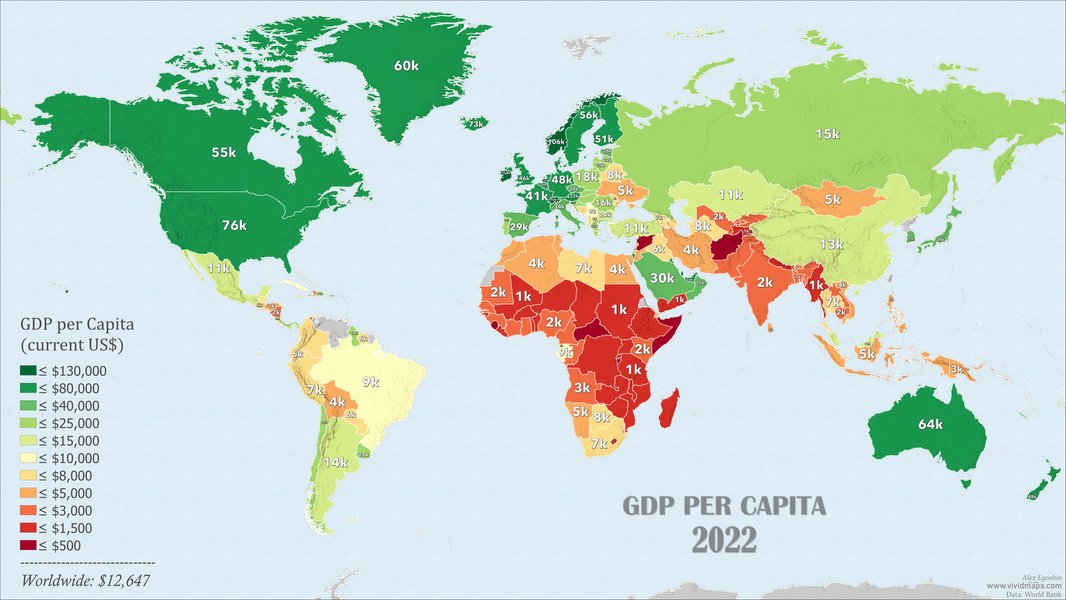
A world map illustrating GDP per capita, offering insights into average economic output per person across different nations.
The Downsides: Limitations of GDP in Intercountry Comparisons
Despite its utility, relying solely on GDP for intercountry comparisons can be misleading due to what it fails to measure and the potential distortions it can create.
Neglect of Income Distribution and Inequality
Averages Mask Disparities
A significant flaw of GDP is that it measures total or average economic output without revealing how income and wealth are distributed within a population. A country might boast a high GDP or GDP per capita, yet a large portion of its citizens could live in poverty if wealth is concentrated in the hands of a few. Two countries with similar GDP per capita figures could have vastly different realities for their average citizens due to disparities in income inequality. This means GDP alone is a poor indicator of overall economic well-being for all segments of society.
Exclusion of Non-Market Activities and the Informal Economy
The Unseen Economy
GDP calculations primarily include transactions that occur in the formal market. They largely overlook non-market activities such as unpaid household work, volunteer services, and subsistence farming. Furthermore, the informal or "shadow" economy, which can be substantial in many developing countries (and present in developed ones), is often not fully captured. This omission can lead to an underestimation of the true economic activity and living standards, particularly when comparing countries with different economic structures and levels of formalization.
Disregard for Quality of Life and Social Well-being
Beyond Monetary Value
GDP is a quantitative measure of economic production, not a qualitative assessment of life. It does not account for factors like health outcomes, education levels, political freedoms, social cohesion, happiness, or leisure time. A country could achieve high GDP growth through means that diminish quality of life, such as long working hours or stressful job environments. Moreover, spending that increases GDP, such as expenditure on disaster reconstruction or increased healthcare costs due to widespread illness, doesn't necessarily equate to an improvement in overall societal well-being.
Environmental Degradation and Sustainability Concerns
The Price of Progress?
GDP does not subtract the costs associated with environmental damage or resource depletion that may occur as a byproduct of economic production. Activities like deforestation, pollution, and overfishing can contribute positively to GDP in the short term but undermine long-term sustainability and well-being. This means a country could appear to be performing well economically according to GDP figures while simultaneously degrading its natural capital, posing risks for future generations. Initiatives like "Green GDP" attempt to address this, but standard GDP does not.
Challenges with Currency Conversion and Price Levels
Comparing Apples to Oranges?
For intercountry GDP comparisons, national figures must be converted to a common currency, typically the US dollar. However, market exchange rates can be volatile and may not accurately reflect the relative purchasing power of currencies in different countries. To address this, economists often use Purchasing Power Parity (PPP) exchange rates, which estimate the amount of money needed to purchase the same basket of goods and services in different countries. While PPP-adjusted GDP offers a more comparable measure of economic output and living standards, nominal GDP comparisons can still be misleading due to these conversion and price level differences.
Other Distorting Factors
Nuances in Measurement
Several other factors can complicate GDP comparisons:
- Foreign Ownership: GDP measures production within a country's borders, regardless of who owns the production factors. Gross National Income (GNI), on the other hand, measures income earned by a country's residents, including income from abroad, and excludes income earned by foreign residents within the country. In nations with significant foreign corporate activity, GDP might overstate the economic benefits accruing to the local population.
- Government Spending Efficiency: Government spending contributes to GDP, but its actual impact on well-being can vary greatly depending on how efficiently and effectively these funds are used.
- Quality of Goods and Services: GDP measures the value of goods and services but not necessarily their quality or the innovation embedded within them.
- Sectoral Health: Aggregate GDP figures might mask underlying issues in specific sectors of an economy. A booming sector could compensate for a struggling one, presenting an overall positive GDP growth that doesn't reflect the full economic picture.
Visualizing GDP's Comparative Strengths and Weaknesses
The following radar chart offers a visual representation of how GDP performs across various dimensions when used as a tool for intercountry economic comparison. The scores are illustrative, reflecting common assessments of GDP's utility in these areas, with higher scores indicating better performance.
This chart highlights GDP's strengths in areas like ease of comparison, data availability, and policy relevance. Conversely, it scores lower on reflecting income equality, capturing non-market activities, focusing on environmental sustainability, and indicating overall quality of life, underscoring its limitations as a sole comparative measure.
Summarizing Pros and Cons: A Mindmap Overview
To provide a concise overview, the following mindmap illustrates the main advantages and disadvantages of using GDP for intercountry economic comparisons.
& Well-being"] id10["Disregards Environmental Costs"] id11["Currency Conversion & PPP Issues"] id12["Can Count Negative Spending
(e.g., disaster recovery) as Positive"] id13["Doesn't Show Sectoral Health"] id14["GDP vs. GNI (Foreign Ownership)"]
This mindmap clearly delineates the dual nature of GDP: a powerful tool for certain types of economic analysis, yet an incomplete one for a holistic understanding of national performance and well-being.
Comparative Table: GDP Pros & Cons at a Glance
This table offers a side-by-side summary of the key advantages and disadvantages when using GDP for comparing economic performance between countries.
| Aspect | Advantages (Pros) | Disadvantages (Cons) |
|---|---|---|
| Measurement & Comparability | Standardized methodology; easy to compare across countries; quantifies economic output. | Currency conversion issues (market exchange rates vs. PPP); may not reflect true purchasing power. |
| Scope of Economic Activity | Captures broad market-based production of goods and services. | Excludes non-market activities (household work, volunteering) and informal/shadow economy. |
| Indication of Well-being | Higher GDP can correlate with better resources for public services. | Does not measure income distribution/inequality; ignores quality of life, health, education, happiness. |
| Sustainability | Can indicate capacity for investment in sustainable practices. | Does not account for environmental degradation or resource depletion; "negative" spending (e.g., pollution cleanup) adds to GDP. |
| Data & Policy | Widely available, historically consistent data; useful for economic policy and investment decisions. | Aggregate figures can mask sectoral weaknesses; focus on GDP growth may lead to neglect of other societal goals. |
| Population Factor | Can be adjusted to GDP per capita for average output per person. | Total GDP can be misleading for welfare if population size is not considered. |
This video provides a detailed explanation of GDP, including concepts like Per Capita and PPP, and discusses its pros and cons, which is highly relevant to understanding its use in intercountry comparisons.
The embedded video, "GDP Fully Explained: Per Capita, PPP, Nominal," delves into the intricacies of Gross Domestic Product. It explains how GDP is calculated, the differences between nominal and real GDP, and the importance of adjustments like GDP per capita and Purchasing Power Parity (PPP) when making international comparisons. The video also touches upon the strengths of GDP as a measure of economic activity and its limitations in reflecting broader societal well-being, aligning with the core themes of our discussion. Understanding these nuances, as presented in the video, is crucial for a balanced perspective on how GDP should be interpreted in a global context.
Frequently Asked Questions (FAQ)
What is GDP and how is it usually calculated for comparisons?
Gross Domestic Product (GDP) is the total monetary value of all finished goods and services produced within a country's borders during a specific period (usually a year). For intercountry comparisons, GDP is typically calculated using either the expenditure approach (Consumption + Investment + Government Spending + Net Exports) or the income approach (sum of all incomes earned). To compare, these values are often converted to a common currency like the US dollar, sometimes adjusted for Purchasing Power Parity (PPP).
Why is GDP per capita often preferred over total GDP for intercountry comparisons?
GDP per capita (total GDP divided by the country's population) is often preferred because it provides an average measure of economic output per person. This helps to account for differences in population size between countries. A country with a very large population might have a high total GDP but a low GDP per capita, suggesting that the average individual economic output or standard of living might be lower than in a smaller country with a higher GDP per capita.
What are some alternatives or complements to GDP for measuring economic performance and well-being?
Several indicators are used to complement or provide alternatives to GDP. These include:
- Human Development Index (HDI): Measures health, education, and standard of living.
- Genuine Progress Indicator (GPI) or Green GDP: Adjust GDP to account for environmental degradation and social costs.
- Gini Coefficient: Measures income inequality within a country.
- Happy Planet Index (HPI): Measures sustainable wellbeing.
- Gross National Income (GNI): Measures income received by residents of a country, including net income from abroad.
How does Purchasing Power Parity (PPP) affect GDP comparisons?
Purchasing Power Parity (PPP) is an economic theory that adjusts exchange rates so that an identical basket of goods and services would cost the same amount in different countries when expressed in a common currency. When comparing GDP across countries, using PPP-adjusted figures can provide a more accurate reflection of relative living standards and economic output because it accounts for differences in price levels. Nominal GDP comparisons using market exchange rates can be misleading if the cost of living varies significantly between countries.
Does a high GDP guarantee a good quality of life for citizens?
No, a high GDP does not guarantee a good quality of life for all citizens. While a higher GDP often means more resources are available, it doesn't reflect how those resources are distributed (income inequality), nor does it account for non-economic factors crucial to well-being such as health, education, environmental quality, social connections, personal security, or happiness. A country can have a high GDP but suffer from significant social or environmental problems.
Recommended Further Exploration
- How does GDP per capita adjusted for PPP provide a better comparison of living standards than nominal GDP?
- What are the main criticisms of using GDP as the primary indicator of a country's success?
- Explore alternative economic indicators to GDP, such as the Human Development Index (HDI) and Genuine Progress Indicator (GPI).
- How does the informal economy impact the accuracy of GDP figures in developing countries?
References
 d1ssu070pg2v9i.cloudfront.net
 drakesbb.wordpress.com
 indieeconomics.wordpress.com
Last updated May 9, 2025