
Comprehensive Analysis of Gene Expression in Pseudomonas aeruginosa Biofilm Formation and Antibiotic Resistance
A Structured Approach to Grouping, Comparing, and Presenting Gene Expression Data
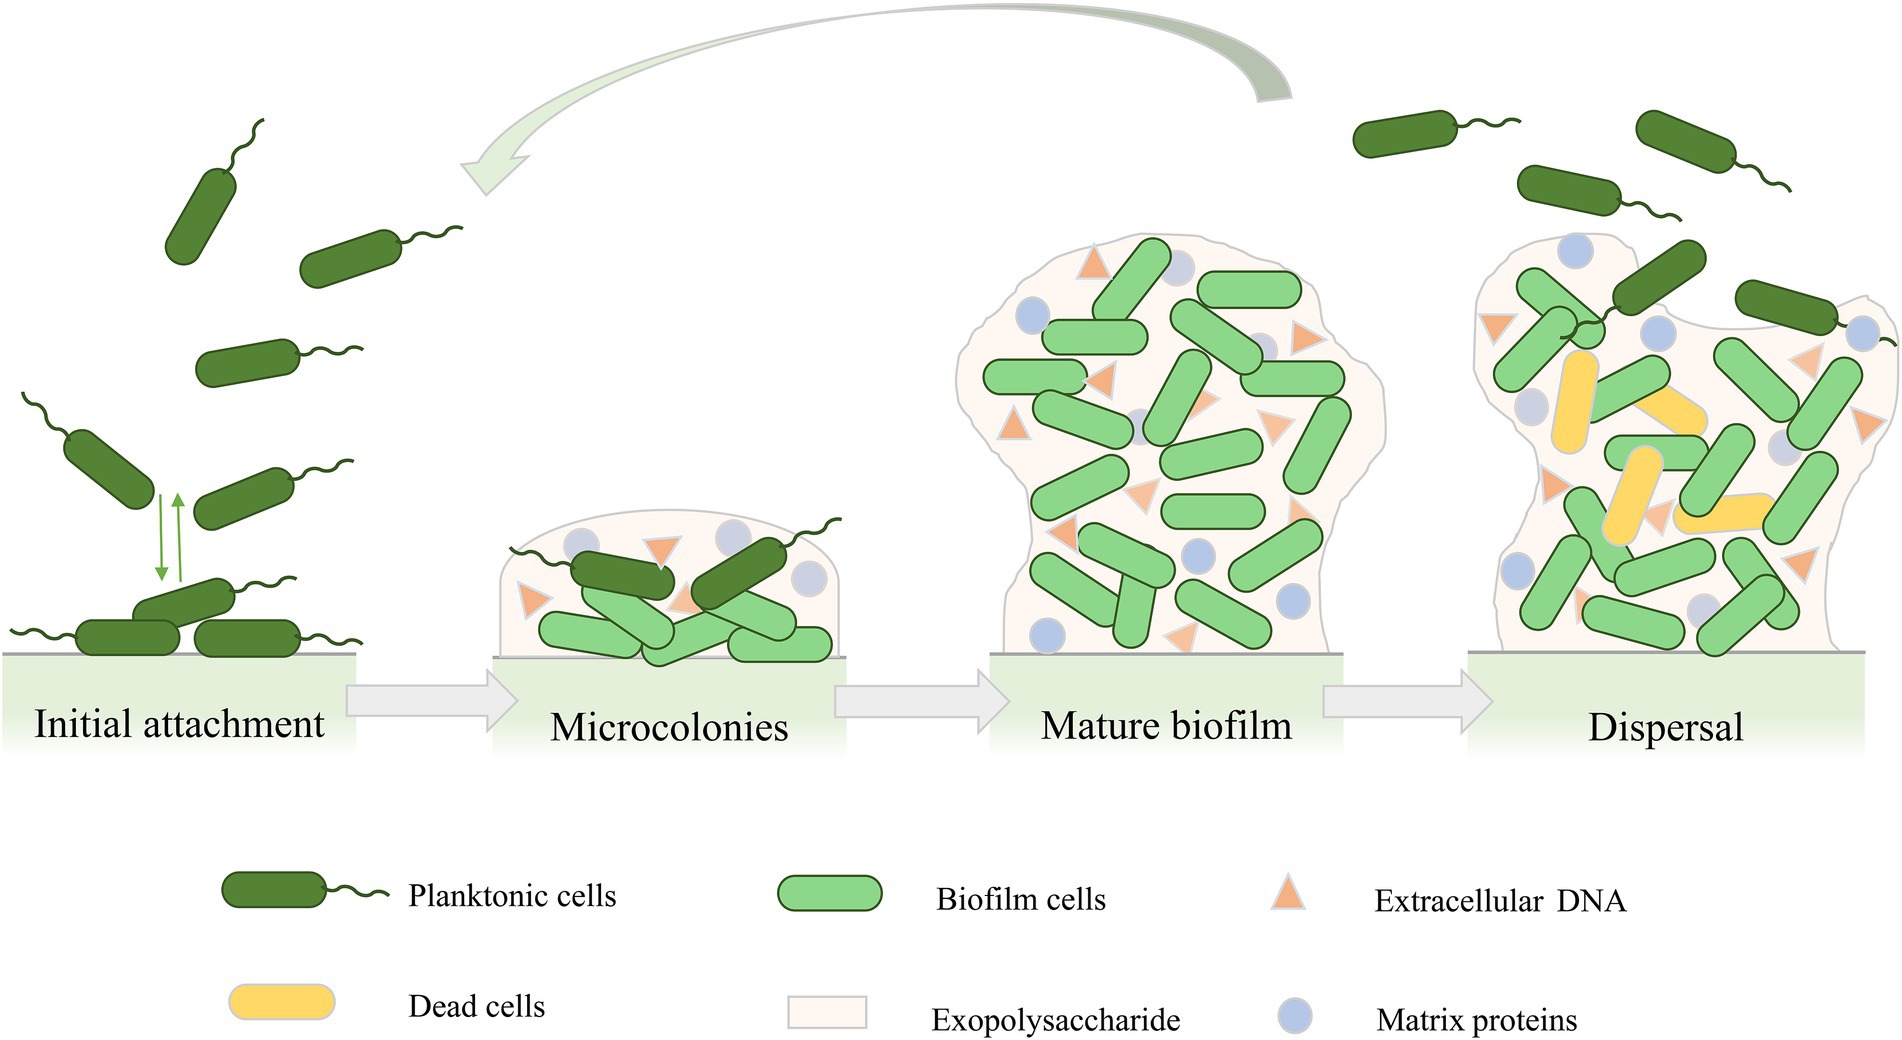
Key Takeaways
- Functional Categorization: Group genes based on their roles in biofilm formation stages and antibiotic resistance mechanisms.
- Comparative Analysis: Conduct within-group and between-group comparisons to identify significant expression patterns and regulatory overlaps.
- Effective Data Presentation: Utilize visual tools like heatmaps and tables, and structure your research paper to clearly convey findings.
1. Grouping Genes into Functional Categories
1.1 Biofilm Formation Stages
Grouping genes based on their involvement in specific stages of biofilm formation provides clarity and facilitates targeted analysis.
A. Initial Attachment and Motility
- Attachment: cupA, fimX, fimW, fliC, pilB
- Motility: fliC, pilB
B. EPS Production and Maturation
- EPS Production: alg44, pelA, pslA, PslG
- Maturation: algR, gacA, mvfR, RsmA
C. Biofilm Maintenance and Dispersal
- Maintenance: bdlA, brlR, BifA
- Dispersal: bdlA, brlR
1.2 Antibiotic Resistance Mechanisms
A. Efflux Pumps
- mexB, mexD, mexF, mexY, emrE
B. Beta-Lactamases
- ampC, VIM, blaIMP, blaOXA50, blaPER, blaVEB, blaNDM
C. Membrane Proteins and Regulators
- oprD, oprF, oprL, oprM, MexR, mexZ
1.3 Virulence Factors and Regulatory Genes
A. Virulence Factors
- exoS, exoT, exoU, exsA, toxA, plcH, pcrV
B. Regulatory Genes
- algR, brlR, BifA, gacA, lasR, rhlR, RsmA, mvfR, ppyR, qteE
2. Comparative Analysis of Gene Expression
2.1 Within-Group Comparisons
Assess the differential expression of genes within each functional category to identify key drivers in biofilm formation and antibiotic resistance.
2.2 Between-Group Comparisons
Evaluate the expression differences between biofilm-related genes and antibiotic resistance genes to uncover potential regulatory overlaps or cross-talk mechanisms.
2.3 Stage-Specific Analysis
Analyze gene expression across different biofilm stages (attachment, maturation, dispersal) to pinpoint stage-specific markers and regulatory elements.
2.4 Correlation of Antibiotic Resistance with Biofilm Formation
Investigate the relationship between the expression of antibiotic resistance genes and biofilm-associated genes to understand how biofilm formation contributes to antibiotic tolerance.
3. Statistical Analysis
3.1 Identification of Differentially Expressed Genes
Utilize statistical methods such as ANOVA or t-tests to determine significant expression changes. Apply multiple testing corrections to account for false discovery rates.
3.2 Clustering and Dimensionality Reduction
Implement hierarchical clustering or Principal Component Analysis (PCA) to visualize and interpret patterns in gene expression data.
3.3 Pathway Enrichment Analysis
Use tools like KEGG or Gene Ontology (GO) enrichment to identify biological pathways that are significantly represented in your dataset.
4. Data Presentation in a Research Paper
4.1 Structuring Your Paper
A. Introduction
- Provide background on Pseudomonas aeruginosa, its biofilm formation, and antibiotic resistance mechanisms.
- State the research objectives and significance of the study.
B. Methods
- Detail the experimental design, including primer selection and gene expression measurement techniques (e.g., qPCR, RNA-seq).
- Explain statistical analysis methods used for data normalization and significance testing.
C. Results
i. Categorization and Group-Specific Analysis
Present a table summarizing gene categories, their functions, and expression changes.
ii. Differential Expression Analysis
Use heatmaps and bar graphs to illustrate significant expression patterns. Highlight key findings such as upregulation of efflux pumps or quorum-sensing regulators.
iii. Correlation with Phenotypes
Discuss correlations between gene expression and phenotypic data like biofilm biomass or antibiotic susceptibility.
D. Discussion
- Interpret the biological implications of the findings, linking them to known mechanisms of biofilm formation and antibiotic resistance.
- Compare results with existing literature to contextualize the study.
- Discuss potential therapeutic targets identified through the analysis.
E. Conclusion
Summarize the study’s contributions to understanding gene regulation in biofilm formation and antibiotic resistance, and suggest future research directions.
F. Figures and Tables
-
Figure 1: Heatmap displaying expression levels of all analyzed genes across different conditions.
-
Figure 2: Bar graphs highlighting significantly upregulated and downregulated genes.
-
Figure 3: Network diagram illustrating interactions between biofilm formation and antibiotic resistance pathways.
-
Table 1: Summary of gene categories, functions, fold changes, and statistical significance.
4.2 Utilizing Visual Tools
A. Heatmaps
<div>
  <h4>Heatmap of Gene Expression Levels</h4>
  <img src="heatmap.png" alt="Heatmap showing gene expression patterns">
</div>
B. Tables
| Gene | Category | Function | Fold Change | p-Value |
|---|---|---|---|---|
| mexB | Efflux Pumps | Antibiotic Resistance | 2.5 | 0.01 |
5. Conclusion
By systematically categorizing and analyzing gene expression data, researchers can uncover intricate details about the regulatory networks governing biofilm formation and antibiotic resistance in Pseudomonas aeruginosa. Utilizing robust statistical methods and effective data visualization enhances the clarity and impact of research findings, paving the way for targeted therapeutic interventions.
6. References
Last updated January 22, 2025