
Unlocking the Secrets of Heredity: Engaging Genetics Projects Enhanced with Visuals
Dive deep into the world of genes and traits through hands-on experiments, computational analysis, and compelling visual storytelling.
Project Highlights
- Hands-on DNA Exploration: Learn to extract DNA and visually document the process, connecting abstract concepts to tangible results.
- Visualizing Inheritance: Utilize Punnett squares, pedigree charts, and creative species design to demonstrate genetic principles clearly.
- Cutting-Edge Genomics: Explore gene editing (CRISPR) and bioinformatics by illustrating complex molecular mechanisms and data visualizations.
Embarking on a college-level genetics project offers a unique opportunity to delve into the intricate mechanisms that govern life itself. Integrating visual elements—from detailed diagrams and infographics to compelling photographs and computational models—can significantly enhance the project's clarity, engagement, and overall impact. A well-crafted visual component transforms abstract genetic concepts into easily digestible insights, making your project both informative and memorable.
Crafting a Compelling Genetics Project
A successful genetics project at the college level requires a blend of rigorous scientific inquiry, analytical skills, and effective communication. The strategic inclusion of images elevates the project beyond mere textual descriptions, providing a dynamic way to present complex information. Here, we explore diverse project ideas that inherently lend themselves to visual enhancement, covering molecular genetics, inheritance patterns, and applied genomics.
Molecular Genetics: Unveiling Life's Blueprints
Projects focused on molecular genetics allow for an in-depth exploration of DNA, RNA, and proteins—the fundamental molecules of heredity. Visuals are paramount in illustrating these microscopic processes and structures.
DNA Extraction and Visualization
One of the most accessible and visually rewarding projects involves extracting DNA from readily available biological materials. This hands-on experience provides a tangible connection to the building blocks of life.
- Project Concept: Perform DNA extraction from common fruits or vegetables like strawberries or onions.
- Visual Integration: Document each step of the extraction process with high-quality photographs. Capture close-up images of the visible DNA strands precipitating out of the solution. Diagrams explaining the chemical principles behind each step (e.g., cell lysis, protein denaturation, DNA precipitation) can complement the photographic evidence. For an advanced touch, compare the visual quality or quantity of extracted DNA from different sources or under varying conditions.
- Educational Value: This project illuminates the physical properties of DNA and introduces basic laboratory techniques, crucial for understanding molecular biology.
The image below depicts laboratory equipment often used in genetics and inheritance studies, which could include tools for DNA extraction and analysis.
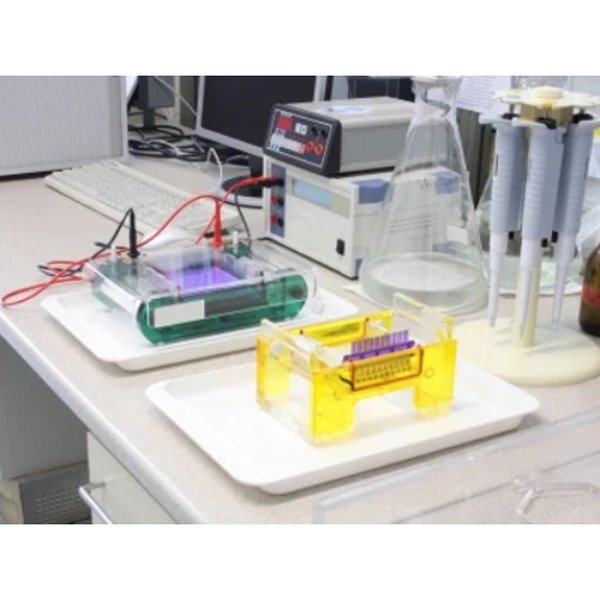
Laboratory equipment commonly utilized in genetics and inheritance research.
Demystifying the Central Dogma
The central dogma of molecular biology—replication, transcription, and translation—describes the flow of genetic information. Visuals are indispensable for clarifying these intricate cellular processes.
- Project Concept: Illustrate the stages of DNA replication, transcription, and translation.
- Visual Integration: Create detailed infographics, flowcharts, or 3D models (digital or physical) to represent each process. Use color-coding to distinguish DNA, mRNA, tRNA, and amino acids. Electron micrographs of ribosomes synthesizing proteins or diagrams showing RNA polymerase at work can significantly enhance the visual narrative.
- Educational Value: This project solidifies understanding of how genetic information stored in DNA is ultimately expressed as functional proteins.
Exploring Inheritance Patterns and Genetic Variation
Projects in this category focus on how traits are passed from one generation to the next and the diversity that arises from genetic differences within populations.
Mendelian Genetics and Punnett Squares
Classical genetics, pioneered by Gregor Mendel, provides foundational principles for understanding inheritance. Punnett squares are a primary visual tool in this area.
- Project Concept: Model the inheritance of specific traits using Punnett squares and pedigree charts.
- Visual Integration: Design clear, labeled Punnett squares to predict genotype and phenotype ratios. Develop comprehensive pedigree charts for hypothetical or real families (with appropriate ethical considerations) to trace dominant, recessive, and X-linked inheritance patterns. Incorporate images of organisms (e.g., pea plants, fruit flies, or human traits like attached vs. unattached earlobes) to vividly illustrate the traits being studied. A creative approach could involve a "Design a Species" project, where you illustrate your imaginary creatures and their inherited traits based on Mendelian rules.
- Educational Value: Reinforces principles of dominance, segregation, and independent assortment, teaching students to predict inheritance outcomes.
This radar chart evaluates various genetics project ideas based on their complexity, visual potential, data analysis opportunity, and ethical considerations. Each spoke represents a different dimension of project evaluation, offering a holistic view of the strengths and weaknesses of different approaches. Higher values indicate a stronger emphasis on that particular aspect within the project type.
Cutting-Edge Applications of Genetics
Modern genetics extends far beyond basic inheritance, with revolutionary applications in medicine, agriculture, and forensics. Visuals are vital for explaining these complex technologies and their societal implications.
CRISPR-Cas9 Gene Editing: Precision Tools for Genetic Modification
CRISPR-Cas9 technology has revolutionized genetic engineering, offering unprecedented precision in editing genes. A project on CRISPR offers a chance to explore a dynamic area of research.
- Project Concept: Detail the mechanism of CRISPR-Cas9 gene editing and explore its applications in treating genetic diseases or enhancing agricultural crops.
- Visual Integration: Use intricate diagrams to illustrate how the guide RNA (gRNA) directs the Cas9 enzyme to a specific DNA sequence and how Cas9 then cuts the DNA. Include "before and after" illustrations of DNA sequences or affected cells/organisms to demonstrate the impact of gene editing. Infographics can effectively present the ethical considerations and potential future applications of this technology.
- Educational Value: Provides insight into a transformative biotechnology, highlighting its scientific principles, potential benefits, and ethical dilemmas.
The image below shows a visualization of a genetic mutation, illustrating how complex biological data can be represented graphically.

An artistic representation depicting the visualization of a genetic mutation, emphasizing the detailed nature of molecular changes.
This video from National Geographic, titled "Genetics 101," provides an excellent introduction to genetics, explaining fundamental concepts like genomes and trait inheritance. It uses clear visuals to convey complex ideas, making it a highly relevant resource for any genetics project aiming to explain basic principles effectively.
Bioinformatics and Genomic Data Visualization
With the advent of high-throughput sequencing, genetics now heavily relies on computational analysis to interpret vast amounts of genomic data. Projects in bioinformatics offer a modern perspective on genetics research.
- Project Concept: Analyze public genomic datasets to identify gene locations, expression patterns, or evolutionary relationships.
- Visual Integration: Utilize screenshots from genome browsers (e.g., UCSC Genome Browser, Ensembl) to illustrate gene loci and their features. Generate heatmaps to visualize gene expression levels across different conditions or tissues. Construct phylogenetic trees to show evolutionary relationships between species based on genetic similarities. These visualizations transform raw data into meaningful biological insights.
- Educational Value: Develops skills in computational biology, data interpretation, and large-scale genomic analysis, preparing students for cutting-edge research.
Choosing the Right Visual Elements
The effectiveness of your genetics project hinges on the thoughtful selection and integration of images. Here’s a guide to ensure your visuals enhance your narrative:
| Visual Type | Description and Best Use | Tools and Resources |
|---|---|---|
| Photographs | Capture real-world phenomena like experimental setups, DNA extraction results, or observable phenotypes. Ensure high resolution and clear focus. | Digital camera, smartphone camera. |
| Diagrams & Illustrations | Explain complex molecular mechanisms (e.g., DNA replication, CRISPR), cellular structures, or genetic crosses. Label all components clearly. | BioRender, Adobe Illustrator, Canva, PowerPoint, Google Drawings. |
| Infographics | Summarize key information, compare concepts (e.g., GMO benefits vs. risks), or present ethical discussions in a visually appealing format. | Canva, Piktochart, Adobe Spark. |
| Charts & Graphs | Represent quantitative data such as trait frequencies, gene expression levels, or population statistics. | Microsoft Excel, Google Sheets, Plotly, R (ggplot2), Python (Matplotlib, Seaborn). |
| 3D Models | Illustrate complex structures like DNA double helix, protein folding, or molecular interactions. Can be physical or digital. | Blender, PyMOL (for protein structures), various molecular visualization software. |
| Pedigree Charts | Graphically represent inheritance patterns within families, tracing traits or disorders across generations. | Online pedigree chart makers, drawing software, or even hand-drawn for simpler cases. |
This table outlines various types of visual elements, their optimal uses in a genetics project, and recommended tools for their creation.
Mindmap of Project Areas
The following mindmap outlines the diverse and interconnected areas within genetics that are suitable for a college project, highlighting the breadth of topics you can explore.
Tips for Effective Image Integration
- Quality and Resolution: Always use high-resolution images that are clear and crisp. Blurry or pixelated images detract from professionalism.
- Relevance: Every image must directly support the text and contribute to the understanding of your topic. Avoid including images simply for aesthetics if they don't add substantive value.
- Labeling and Captions: Each image should have a concise, descriptive caption explaining its content and relevance. Key elements within diagrams should be clearly labeled.
- Attribution: Always cite the source of any image that is not your original work. Adhere to academic citation standards and be mindful of copyright. Public domain image galleries (e.g., NHGRI Image Gallery) or creative commons licensed images are excellent resources.
- Originality: Where possible, create your own diagrams, infographics, or take original photographs. This demonstrates deeper understanding and adds a unique touch to your project.
Frequently Asked Questions
What makes a genetics project visually compelling?
Where can I find reliable images for my genetics project?
Should I create my own images or use existing ones?
How many images should I include in my project?
Conclusion
A genetics college project with integrated images offers a powerful platform to explore, analyze, and communicate the fascinating world of heredity. By combining rigorous scientific inquiry with thoughtful visual storytelling, you can create a project that is not only academically sound but also highly engaging and impactful. Whether you choose to extract DNA, model inheritance, explore cutting-edge gene editing, or delve into computational genomics, strategic visual integration will elevate your project and deepen your understanding of this vital scientific field.
Recommended Further Exploration
- How to visually represent complex genomic data for a college project?
- Ethical considerations in genetic engineering projects with visual aids.
- Hands-on molecular biology experiments suitable for undergraduate projects.
- Tools and software for creating scientific diagrams and infographics in genetics.