
Unlocking the Mystery of GHG Calculations in Pharma
Mastering Emission Tracking for Sustainable Drug Production
Key Highlights of GHG Emission Calculations in Pharmaceuticals
- GHG Protocol Dominance: The Greenhouse Gas Protocol is the cornerstone framework, categorizing emissions into scopes for accurate tracking and reduction.
- Scope 3 Emphasis: Often comprising up to 90% of total emissions, Scope 3 requires detailed assessment of the supply chain, highlighting indirect impacts in pharmaceuticals.
- Life Cycle Integration: Comprehensive methodologies like Life Cycle Assessment (LCA) ensure a holistic view, from raw material extraction to end-of-life disposal, identifying key emission hotspots.
In the pharmaceutical industry, calculating greenhouse gas (GHG) emissions is a critical process for understanding environmental impact and driving sustainability. This involves standardized frameworks that account for direct and indirect emissions across the entire value chain. By synthesizing expert insights, this guide provides a detailed, cohesive explanation of how emissions are quantified, ensuring accuracy and actionable outcomes.
Understanding Emission Scopes in Pharmaceuticals
Emissions are categorized into three scopes under the GHG Protocol, which is universally adopted for its structured approach. This classification helps identify where emissions originate and guides targeted reduction strategies.
Scope 1: Direct Emissions from Owned Sources
Scope 1 emissions encompass all direct GHG releases from sources controlled by the pharmaceutical company. This includes on-site activities such as fuel combustion in boilers, emissions from manufacturing processes, and vehicle fleets. For instance, during drug formulation, chemical reactions and energy-intensive steps like heating solvents contribute significantly. Calculations involve measuring the volume of fuels or gases used and applying specific emission factors, which convert activity data into CO2 equivalents. Emission factors are sourced from reliable databases, ensuring precision in quantifying these direct impacts.
Scope 2: Indirect Emissions from Purchased Energy
Scope 2 emissions arise from the generation of energy that the company purchases, such as electricity, steam, or cooling. In pharmaceuticals, this is crucial due to high energy demands in facilities for processes like refrigeration and purification. Two methods are used for calculation: location-based, which relies on average emission factors for the regional grid, and market-based, which considers renewable energy purchases. For example, multiplying kilowatt-hours of electricity consumed by the appropriate emission factor provides a clear estimate. This scope often highlights opportunities for transitioning to renewable sources to reduce overall carbon footprints.
Scope 3: Comprehensive Indirect Emissions Across the Value Chain
Scope 3 is the most extensive category, covering indirect emissions from upstream and downstream activities. In pharmaceuticals, it typically accounts for the majority of emissions, often around 90%, due to complex supply chains involving raw material extraction, transportation, and product disposal. Key components include emissions from suppliers, logistics, and end-user activities, such as waste from hospitals. Calculations require multiplying activity data—like material quantities or transport distances—by emission factors. Tools from the Pharmaceutical Supply Chain Initiative (PSCI) aid in this process, emphasizing the need for collaborative data sharing to address challenges like data gaps and variability.
Step-by-Step Process for GHG Emission Calculations
The calculation process follows a systematic approach to ensure accuracy and reproducibility. It begins with defining boundaries and ends with reporting, incorporating data from various sources.
Data Collection and Boundary Setting
Accurate data collection is foundational, involving metrics such as energy consumption, raw material usage, and transportation details. Companies define the scope of assessment, deciding whether to focus on a single facility, product, or the entire organization. This step often uses life cycle inventories to capture data from cradle-to-grave, identifying emission hotspots early.
Applying Emission Factors and Aggregation
Emission factors, derived from standardized sources, are multiplied by activity data to estimate GHG quantities. For example, in API manufacturing, factors account for the high carbon intensity of solvents. Aggregation sums emissions across scopes, with software tools automating calculations for efficiency. This method ensures that all emissions are converted to CO2 equivalents for consistent reporting.
Key Calculation Tools and Resources
Various tools enhance precision, including the GHG Protocol's calculators and the EPA's Simplified GHG Emissions Calculator. These platforms integrate emission factors and allow for scenario analysis, helping companies refine their strategies.
Methodologies and Advanced Techniques
Beyond basic scope calculations, advanced methodologies provide deeper insights into the pharmaceutical lifecycle.
Life Cycle Assessment (LCA) for Holistic Analysis
LCA evaluates emissions from raw material extraction to disposal, using process-based models to quantify impacts. For pharmaceuticals, this reveals hotspots like solvent use in API production, guiding optimizations such as continuous manufacturing, which can reduce emissions by up to 69%.
Input-Output Analysis for Supply Chain Insights
Environmentally extended multi-regional input-output (EE-MRIO) analysis traces emissions across global supply chains, attributing them to pharmaceutical expenditures. This method complements LCA by providing a broader economic perspective, essential for Scope 3 accuracy.
This mindmap illustrates the sequential steps in GHG calculation, offering a clear visual overview of how data flows from collection to reporting. It highlights the interconnected nature of each phase, aiding in understanding the comprehensive approach required in pharmaceuticals.
Challenges and Solutions in Pharmaceutical GHG Accounting
While standardized methods exist, pharmaceuticals face unique challenges due to their complex operations.
Data Availability and Variability Issues
Scope 3 emissions are particularly difficult to quantify due to reliance on supplier data, which may be inconsistent or incomplete. Emission factor variability for chemicals adds uncertainty, complicating comparisons across companies.
Strategies for Mitigation and Improvement
Solutions include simplifying calculations by focusing on high-impact categories and using collaborative initiatives like PSCI. Adopting renewable energy and optimizing logistics can significantly reduce emissions, with examples from companies like Amgen demonstrating substantial cuts through process innovations.
This radar chart visualizes the relative contributions of different emission sources in pharmaceuticals, based on synthesized data from industry analyses. It underscores the dominance of supply chain emissions, guiding focus areas for reduction efforts and enhancing the interpretability of complex data.
Illustrative Video on GHG Calculations
To further clarify the calculation process, this video demonstrates practical steps for measuring greenhouse gas emissions, directly applicable to pharmaceuticals. It provides a real-world example of using tools and data, enriching understanding of the methodologies discussed.
Visualizing Pharmaceutical Emissions
The following image depicts the carbon footprint trends in the pharmaceutical industry, highlighting emission intensities and comparisons. It complements the discussion on scope calculations by showing real data visualizations.
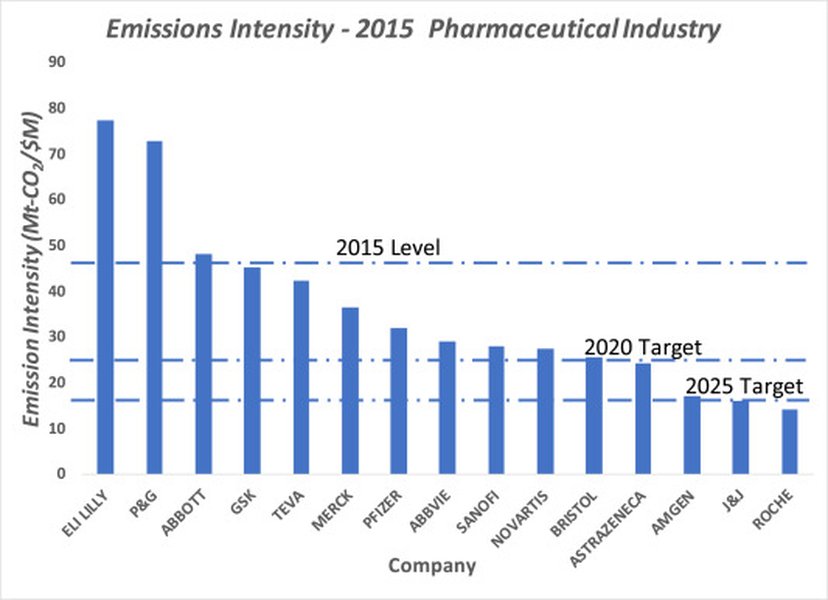
Graph showing carbon emission factors in pharmaceuticals, sourced from scientific literature.
FAQ
What are the main scopes in GHG emissions for pharmaceuticals?
Why is Scope 3 so important in this industry?
What tools can help with GHG calculations?
How can companies reduce their GHG emissions?
Conclusion
In conclusion, calculating GHG emissions in pharmaceuticals is a multifaceted process that integrates standardized protocols, advanced methodologies, and collaborative tools to achieve precise and actionable insights. By addressing challenges through innovation and data-driven approaches, the industry can significantly reduce its environmental impact, contributing to global sustainability goals.
Recommended Searches
- How to reduce Scope 3 emissions in pharmaceuticals
- Best practices for LCA in drug manufacturing
- Sustainable supply chain strategies in pharma
- Impact of renewable energy on pharma emissions