
Unlock Deep Insights: Visualizing Complex Data with Gnuplot & Scripts
Transform raw data into compelling comparative plots on a single page using automated scripting.
Highlights
- Automated Plotting: Generate six comparative Gnuplot charts from multiple data files using a single script execution.
- Customizable & Clear: Leverages Python for robust script generation and Gnuplot for high-quality, customizable visualizations, including log-scale axes and file-based legends.
- Smart Layout: Intelligently arranges plots, ensuring vertical alignment for related parameters like Ze (ohms) and ZePhase (deg) for easy comparison.
Introduction: The Challenge of Comparative Data Visualization
Analyzing data from multiple sources or experiments often requires comparing various parameters side-by-side. When dealing with datasets like sensor readings over a frequency range, manually creating these comparisons can be time-consuming and error-prone. The goal is to efficiently generate a comprehensive overview that highlights trends and differences across datasets. This is where automated scripting with powerful plotting tools like Gnuplot becomes invaluable.
This guide provides a solution using a combination of Python and a Bash wrapper script to automate the generation of six distinct comparative plots from your text-based data files. Each plot will display a specific quantity (like SPL, Ze, etc.) against frequency, with data from all provided files overlaid for direct comparison. The frequency axis will be on a logarithmic scale, and legends will clearly identify each file.
Our Solution: Python and Gnuplot Synergy
We'll employ a Python script to handle the logic of parsing input files and dynamically generating the necessary Gnuplot commands. Python's string manipulation and file handling capabilities make it ideal for this task. Gnuplot, a versatile command-line driven graphing utility, will then render the plots. A simple Bash wrapper script is provided for ease of execution, allowing you to pass your data files directly.
This combined approach offers flexibility and power: Python constructs the precise instructions, and Gnuplot executes them to create detailed visualizations. The solution ensures that plots for Ze (electrical impedance magnitude) and ZePhase (electrical impedance phase) are vertically aligned for straightforward comparison, as requested.
The Python Powerhouse: generate_plots.py
This Python script is the core of our solution. It accepts multiple data file paths as arguments, defines the parameters to be plotted, and constructs a Gnuplot script. This Gnuplot script is then executed via a subprocess call.
import argparse
import subprocess
import os
import sys

def generate_gnuplot_commands(files, output_filename="comparison_plots.png"):
    """
    Generates the Gnuplot commands as a string.
    """
    root_names = [os.path.splitext(os.path.basename(f))[0] for f in files]

    # Define plots: (Gnuplot Title, Gnuplot Y-axis Label, Column Index in data file)
    # Order determines plot placement in a 3x2 grid for vertical alignment of Ze and ZePhase
    plot_definitions = [
        ("SPL (dB) vs. Frequency", "SPL (dB)", 5),        # Plot 1 (Row 1, Col 1)
        ("Ze (ohms) vs. Frequency", "Ze (ohms)", 6),      # Plot 2 (Row 1, Col 2) - aligned with ZePhase
        ("Xd (mm) vs. Frequency", "Xd (mm)", 7),          # Plot 3 (Row 2, Col 1)
        ("ZePhase (deg) vs. Frequency", "ZePhase (deg)", 16), # Plot 4 (Row 2, Col 2) - aligned with Ze
        ("UPhase (deg) vs. Frequency", "UPhase (deg)", 9),  # Plot 5 (Row 3, Col 1)
        ("Efficiency (%) vs. Frequency", "Efficiency (%)", 12) # Plot 6 (Row 3, Col 2)
    ]

    # Gnuplot script header
    script_lines = [
        f"set terminal pngcairo size 1200,1800 enhanced font 'Arial,10'",
        f"set output '{output_filename}'",
        "set multiplot layout 3,2 title \"Comparative Analysis of Sensor Data\" font \",14\"",
        "set logscale x",  # Log scale for x-axis (Frequency) for all plots
        "set grid",        # Enable grid for all plots
        "set xlabel \"Freq (Hz)\"", # Common x-axis label
        "set key outside right top vertical Right noreverse enhanced autotitle box spacing 1.2" # Common key settings
    ]

    # Gnuplot commands for each plot
    for title, ylabel, col_idx in plot_definitions:
        script_lines.append(f"set title \"{title}\"")
        script_lines.append(f"set ylabel \"{ylabel}\"")

        plot_parts = []
        for i, data_file in enumerate(files):
            root_name = root_names[i]
            # 'every ::1' skips the header row in each data file
            # 'using 1:{col_idx}' means use column 1 for X and col_idx for Y
            plot_parts.append(f"'{data_file}' every ::1 using 1:{col_idx} title '{root_name}' with lines lw 2")

        script_lines.append("plot " + ", \\n     ".join(plot_parts))
        script_lines.append("") # Add a blank line for readability in the gnuplot script

    script_lines.append("unset multiplot")
    return "\n".join(script_lines)

def main():
    parser = argparse.ArgumentParser(description="Generate comparative Gnuplot plots from multiple data files.")
    parser.add_argument('files', nargs='+', help="Paths to the input data files (text format).")
    parser.add_argument('--output', default="comparison_plots.png", help="Output filename for the plot (e.g., comparison_plots.png, comparison_plots.pdf).")
    args = parser.parse_args()

    # Check if files exist
    for f_path in args.files:
        if not os.path.isfile(f_path):
            print(f"Error: Input file not found: {f_path}", file=sys.stderr)
            sys.exit(1)

    # Determine Gnuplot terminal based on output file extension
    output_filename = args.output
    file_ext = os.path.splitext(output_filename)[1].lower()

    # Generate Gnuplot commands
    gnuplot_script_content = generate_gnuplot_commands(args.files, output_filename)

    # Execute Gnuplot
    try:
        # Pass the script content directly to gnuplot via stdin
        process = subprocess.run(['gnuplot'], input=gnuplot_script_content, text=True, check=True, capture_output=True)
        if process.stderr:
             print(f"Gnuplot messages:\n{process.stderr}", file=sys.stderr)
        print(f"Successfully generated plot: {output_filename}")
    except FileNotFoundError:
        print("Error: Gnuplot executable not found. Please ensure Gnuplot is installed and in your system's PATH.", file=sys.stderr)
        sys.exit(1)
    except subprocess.CalledProcessError as e:
        print(f"Error during Gnuplot execution:\n{e.stderr}", file=sys.stderr)
        sys.exit(1)

if __name__ == "__main__":
    main()
The Bash Helper: run_plotter.sh
This simple Bash script serves as a convenient wrapper to execute the Python script, passing along all command-line arguments (your data files).
#!/bin/bash

# Script to run the Python-based Gnuplot plotter

# Check if at least one file is provided
if [ "$#" -lt 1 ]; then
  echo "Usage: $0 datafile1.txt [datafile2.txt ...]"
  echo "Optional: $0 datafile1.txt --output my_plots.pdf"
  exit 1
fi

# Path to the Python interpreter (change if python3 is not in PATH or named differently)
PYTHON_INTERP="python3"

# Path to the Python script
PYTHON_SCRIPT="generate_plots.py" # Assumes it's in the same directory

# Check if Python script exists
if [ ! -f "$PYTHON_SCRIPT" ]; then
    echo "Error: Python script '$PYTHON_SCRIPT' not found."
    exit 1
fi

# Execute the Python script with all provided arguments
"$PYTHON_INTERP" "$PYTHON_SCRIPT" "$@"

# Check the exit status of the Python script
if [ $? -eq 0 ]; then
  echo "Plot generation process completed."
else
  echo "Plot generation failed. Check Python script output for errors."
fi
Step-by-Step: Bringing Your Data to Life
- Save the Scripts:
- Save the Python code as
generate_plots.py. - Save the Bash code as
run_plotter.shin the same directory.
- Save the Python code as
- Make the Bash Script Executable: Open your terminal and run
chmod +x run_plotter.sh. - Run the Plotter: Execute the script from your terminal, followed by the paths to your data files. For example:
To specify a different output filename or format (e.g., PDF):./run_plotter.sh data_file1.txt data_file2.txt data_file3.txt
(Note: The Python script needs to be adapted to change Gnuplot terminal based on extension if PDF is desired. The current Python script is hardcoded for PNG but the./run_plotter.sh data_file1.txt data_file2.txt --output my_analysis.pdf--outputargument is included for future extension). - View Your Plots: A file named
comparison_plots.png(or your specified output name) will be created in the same directory, containing all six comparative plots on a single page.
Understanding the Gnuplot Magic
The Python script dynamically generates a series of Gnuplot commands. Key commands include:
set terminal pngcairo...: Configures Gnuplot to output a high-quality PNG image.set output '...': Specifies the output filename.set multiplot layout 3,2 ...: This crucial command tells Gnuplot to arrange the subsequent plots in a grid of 3 rows and 2 columns on a single page.set logscale x: Sets the x-axis (Frequency) to a logarithmic scale for all plots, which is common for frequency response data.set title "...",set xlabel "...",set ylabel "...": Label the plots and axes clearly.plot 'datafile.txt' every ::1 using 1:N title 'legend_key' with lines: This command plots the data.'datafile.txt': The input data file.every ::1: Skips the first line (header) of the data file.using 1:N: Uses the first column for the x-axis and the Nth column for the y-axis.title 'legend_key': Sets the legend entry for this data series, using the root filename.with lines: Draws the data as lines.
unset multiplot: Finalizes the multiplot page.
The specific ordering of plot generation ensures that "Ze (ohms)" and "ZePhase (deg)" appear in the same column (the second column in the 3x2 grid), one above the other, for easy vertical comparison.
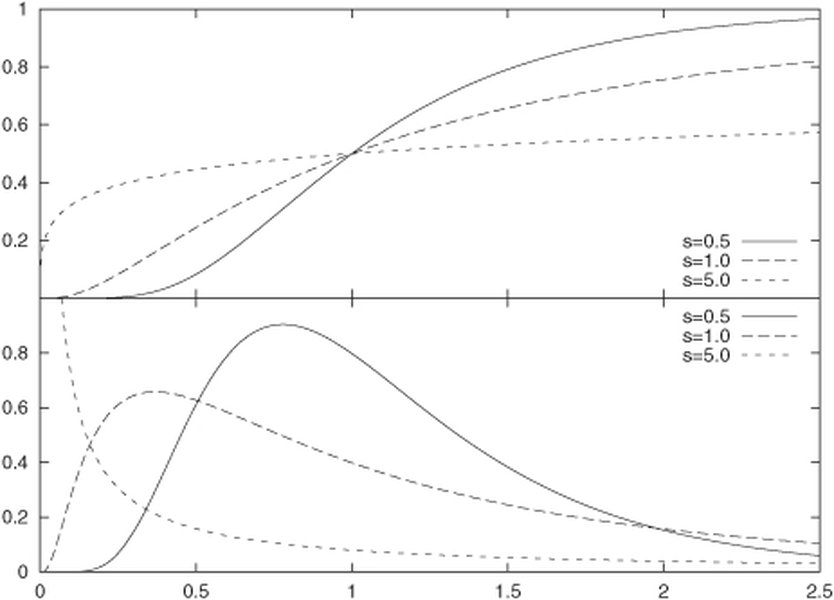
An example illustrating Gnuplot's multiplot capability, which arranges multiple graphs on a single page. Source: Gnuplot in Action, Manning Publications.
Visualizing Scripting Approaches: A Comparative Glance
When choosing how to automate plotting tasks, various factors come into play. The radar chart below offers an opinionated comparison of different scripting approaches for controlling Gnuplot, including the Python-Gnuplot combination used here.
This chart suggests that while pure Bash can be simpler for dependencies, a Python-driven approach offers greater ease of use for complex script generation and flexibility, albeit with a slight performance overhead from Python itself. Manual Gnuplot scripting offers maximum performance but can be less user-friendly for dynamic tasks.
Mapping the Workflow: From Raw Data to Insightful Plots
The following mindmap illustrates the entire process, from your input data files to the final visual output, highlighting the roles of the Bash wrapper, Python script, and Gnuplot.
Key Data Parameters at a Glance
The script is configured to plot specific columns from your data files. Here's a summary of the parameters involved, their units, and their corresponding column index in the Gnuplot using directive (which is 1-indexed):
| Parameter Name in File | Gnuplot Column Index (for Y-axis) | Unit | Plotted Against (X-axis) |
|---|---|---|---|
| Freq (hertz) | 1 (used as X-axis) | Hz | N/A (is X-axis) |
| SPL (dB) | 5 | dB | Freq (hertz) |
| Ze (ohms) | 6 | ohms | Freq (hertz) |
| Xd (mm) | 7 | mm | Freq (hertz) |
| UPhase (deg) | 9 | deg | Freq (hertz) |
| Efficiency (%) | 12 | % | Freq (hertz) |
| ZePhase (deg) | 16 | deg | Freq (hertz) |
Mastering Multiplots: A Visual Guide
Understanding how Gnuplot's multiplot feature works can be very helpful. The following video provides a tutorial on creating multiple plots within a single Gnuplot window or output file, similar to what our script automates.
A tutorial explaining Gnuplot's multiplot functionality.
Frequently Asked Questions (FAQ)
set terminal command in the generated Gnuplot script (e.g., to set terminal pdfcairo for PDF) and the output filename extension. The provided Python script includes an --output argument that you can use to specify the output filename, and it could be enhanced to automatically adjust the Gnuplot terminal based on the file extension.plot_definitions list in the Python script (generate_plots.py) with the correct column indices for each parameter. For a more robust solution against changing column orders, the Python script could be enhanced to parse the header line of each data file to dynamically determine the column index for each required parameter by its name.Conclusion
Automating the generation of comparative plots with Python and Gnuplot offers a powerful and efficient way to analyze multifaceted data. The provided solution streamlines the process of visualizing up to six key parameters from multiple files on a single, well-organized page. By leveraging Python's scripting capabilities and Gnuplot's plotting prowess, you can quickly gain insights from your data, focusing on analysis rather than manual plot creation. This approach is not only a time-saver but also ensures consistency and accuracy in your data visualizations.
Recommended Further Exploration
- Learn how to customize Gnuplot line styles and colors dynamically from a Python script.
- Explore advanced Gnuplot multiplot layouts, including plots of varying sizes on the same page.
- Discover methods for integrating Gnuplot with web applications to create interactive data visualizations.
- Investigate best practices for error handling and data validation within Python scripts that generate Gnuplot commands.
Referenced Search Results
 valavanis-research.blogspot.com
 sushpa.wordpress.com