
Gold's Next Move: Unpacking Price Predictions for the Coming Weeks (May 2025)
An in-depth analysis of technical signals, market drivers, and expert sentiment shaping gold's short-term outlook.
As of mid-May 2025, the gold market is navigating a period of notable fluctuation. Investors and traders are keenly observing its trajectory for the upcoming days and weeks. This analysis synthesizes current data, technical indicators, and macroeconomic factors to provide a comprehensive forecast for gold prices.
Highlights: Gold's Short-Term Forecast
- Price Volatility Expected: Gold is anticipated to experience fluctuations, with potential trading ranges broadly estimated between $3,100 and $3,350 per ounce in the near term. Recent prices have hovered around $3,208 after a dip.
- Mixed Technical Signals: While some underlying chart patterns suggest bullish potential, indicators like the RSI point to overbought conditions and possible bearish divergence, and the MACD indicates weakening bullish momentum.
- Key Influencers: The primary drivers for gold's price in the coming weeks will be developments in US-China trade relations, signals from the Federal Reserve regarding monetary policy and inflation, and shifts in global risk sentiment.
Current Gold Market Snapshot
Recent Price Movements and Current Standing
As of May 13, 2025, gold prices have seen a pullback, with recent figures indicating a level around $3,207.82 per troy ounce. This marks a two-week low, largely attributed to a wave of optimism in financial markets stemming from positive headlines regarding US-China trade discussions, specifically an agreement to roll back tariffs for 90 days. This easing of trade tensions temporarily dampened gold's appeal as a safe-haven asset. The US Dollar has also shown strength, partly due to a "hawkish pause" by the Federal Reserve and reduced fears of an immediate US recession, further pressuring gold prices, which typically move inversely to the dollar.
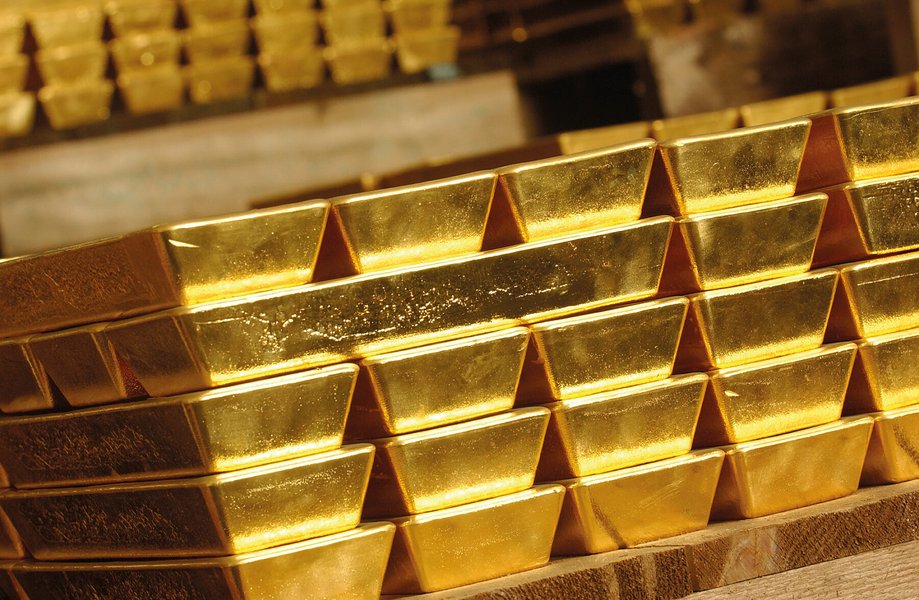
Gold bullion bars, representing the precious metal's enduring value.
Short-Term Price Expectations (Next Few Days to Weeks)
For the immediate future, gold prices are expected to exhibit moderate fluctuations. Some algorithmic forecasts suggest:
- By Monday, May 19, 2025, the price could potentially reach around $3,143 per troy ounce, with a possible trading range between $2,986 and $3,300.
- For the week around May 26, 2025, forecasts indicate a slightly lower average, possibly near $3,132, within a range of $2,964 to $3,300.
Deep Dive: Factors Shaping Gold's Near-Term Trajectory
Technical Analysis Signals
The technical landscape for gold presents a mixed, yet cautiously bullish, picture, demanding careful interpretation of various signals.
Key Chart Patterns
Recent analysis highlighted the "Three White Soldiers" pattern on weekly timeframes, historically suggesting strong bullish momentum (though this formed from a lower base price). However, more recently, the appearance of Doji candlestick patterns near historical highs (around $2,965-$3,000 and higher levels) indicates market indecision and potential for consolidation. Some analysts also point to a potential bull flag pattern, which, if confirmed with a breakout, could propel gold towards higher targets like $3,500.
Indicator Readings (RSI, MACD, MFI)
- Relative Strength Index (RSI): The RSI is showing a bearish divergence, suggesting that despite recent price highs, the momentum behind the upward moves may be waning. This often signals overbought conditions and can precede a price correction or consolidation.
- Moving Average Convergence Divergence (MACD): The MACD, while still in positive territory, is declining. This indicates that the strength of the current bullish trend is weakening, though it hasn't yet confirmed a bearish reversal.
- Money Flow Index (MFI): The MFI suggests that liquidity inflow remains active and long positions are still dominant, providing some underlying support.
Support and Resistance Levels
Understanding key price thresholds is crucial for navigating gold's short-term movements:
- Support Levels: Immediate support is seen around the $3,200 mark, where buying interest has re-emerged. A break below this could see prices test lower supports, potentially near $3,100 or even $3,000 in a more significant downturn.
- Resistance Levels: On the upside, initial resistance lies near $3,300 - $3,351. A decisive break above this zone could open the path towards $3,449, and subsequently higher targets like $3,500, $3,581, or even $3,794 if strong bullish momentum returns.
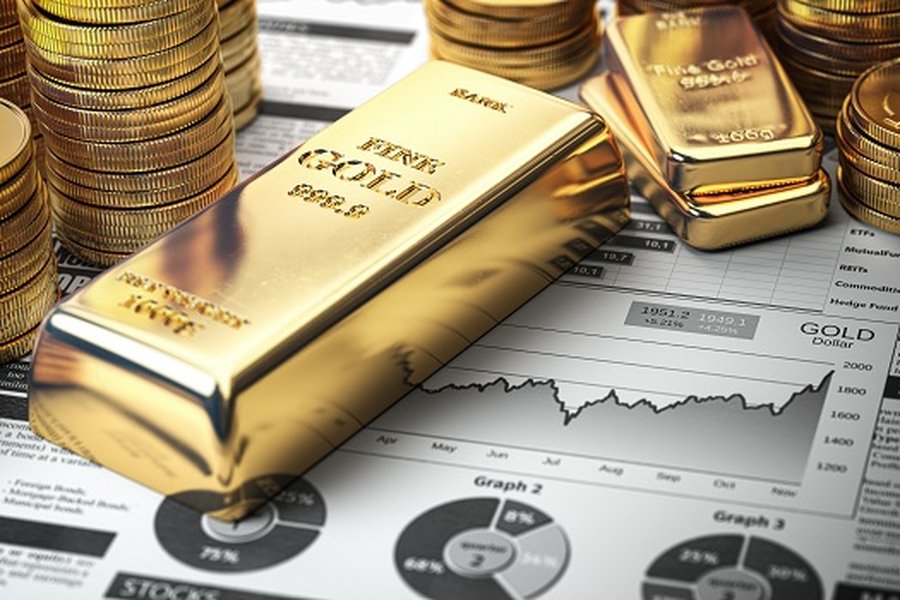
Illustrative market chart depicting price fluctuations common in commodities like gold.
Macroeconomic & Geopolitical Influences
Gold's price is intricately linked to broader economic and geopolitical currents.
US-China Trade Relations
Recent announcements of a 90-day tariff rollback agreement between the US and China have injected optimism into global markets, thereby reducing the immediate demand for gold as a safe-haven asset. This factor has contributed to the recent dip in gold prices. However, the situation remains fluid, and any rekindling of trade disputes or uncertainty in negotiations could quickly reverse this sentiment and bolster gold.
Federal Reserve Policy and USD Strength
The Federal Reserve's current "hawkish pause" stance on interest rates, coupled with an easing of US recession fears, has lent strength to the US Dollar. A stronger dollar typically exerts downward pressure on gold prices, as gold becomes more expensive for holders of other currencies. Future pronouncements from the Fed regarding inflation, economic growth, and potential shifts in monetary policy will be critical. Any hint of a more dovish stance or rising inflation concerns could weaken the dollar and support gold.
Global Economic Uncertainty & Inflation
Despite some recent optimism, underlying global economic uncertainties and geopolitical tensions persist. Gold traditionally thrives in such environments due to its status as a store of value. Rising inflation also tends to boost gold's appeal as an inflation hedge. Key economic data releases, such as inflation reports (CPI, PPI), employment figures, and GDP growth, from major economies will significantly influence gold sentiment.
Safe-Haven Demand vs. Risk Appetite
Investor risk appetite is a key determinant of short-term gold movements. When market optimism is high and investors favor riskier assets (like equities), gold's safe-haven allure diminishes. Conversely, during periods of market stress or heightened geopolitical risk, capital flows into gold. The current environment shows fluctuating risk appetite, leading to gold price volatility.
Market Sentiment and Positioning
Central Bank Activity
Sustained purchasing by central banks, notably the People's Bank of China, continues to provide a significant pillar of support for the gold market. This consistent demand can help absorb some selling pressure and put a floor under prices, especially during dips.
Investor and Speculator Stance
The positioning of speculators in futures markets can influence short-term price movements. Reports indicate that speculators have recently reduced their net long positions in gold, which can weigh on prices. However, should economic data worsen or geopolitical tensions escalate, ETF inflows could increase, reflecting renewed investor demand for gold as a protective asset.
Visualizing Gold Market Influences
To better understand the complex interplay of factors affecting gold prices, the following radar chart illustrates the perceived current influence of key drivers and their potential shift in the coming weeks. The scores are on a scale of 1 to 10, where a higher score indicates a stronger influence (or a more positive impact on gold prices, depending on the factor). For instance, a high score for "USD Strength" typically means a stronger dollar, which is generally negative for gold, while a high score for "Geopolitical Tension" is typically positive for gold.
Key Influencers Mindmap
This mindmap provides a hierarchical view of the primary categories and sub-factors influencing gold's price in the short term. It helps visualize the connections between broad market themes and specific drivers.
(Short-Term: Next Few Days/Weeks)"] id1["Technical Analysis"] id1a["Support & Resistance Levels
Support: ~$3200, ~$3100
Resistance: ~$3300, ~$3350, ~$3500"] id1b["Key Chart Patterns
Doji (Indecision)
Bull Flag (Potential Upside)
Three White Soldiers (Past Bullishness)"] id1c["Indicator Readings
RSI (Bearish Divergence, Overbought)
MACD (Weakening Bullish Trend)
MFI (Liquidity Inflow)"] id2["Macroeconomic Factors"] id2a["US-China Trade Relations
Tariff Rollbacks (Temporary Gold Negative)
Ongoing Negotiations (Volatility Source)"] id2b["Federal Reserve Policy & USD
Hawkish Pause (USD Positive, Gold Negative)
Inflation Data (CPI, PPI critical)
Future Rate Path Expectations"] id2c["Global Economic Uncertainty
Recession Risks (If re-emerge, Gold Positive)
Geopolitical Events"] id2d["Inflation Dynamics
Persistent Inflation (Gold Positive)"] id3["Market Sentiment & Positioning"] id3a["Safe-Haven Demand
Fluctuates with Risk Appetite"] id3b["Investor Risk Appetite
Optimism (Gold Negative)
Pessimism (Gold Positive)"] id3c["Central Bank Activity
Consistent Buying (Supportive)"] id3d["Speculator Positions
Net Longs Reduced (Potential Pressure)"]
Key Short-Term Gold Price Influencers
The following table summarizes key categories influencing gold prices in the near term, their current state, potential impact, and crucial indicators to watch:
| Influencing Category | Current Observation / State | Potential Impact (Next Few Weeks) | Key Indicators to Monitor |
|---|---|---|---|
| Technical Indicators | Mixed signals: Bearish RSI divergence, weakening MACD, but some bullish patterns. Key support near $3,200. | High volatility likely. A break below support could lead to further dips; holding support might signal consolidation or a rebound. | Price action around $3,200, $3,300, $3,350. Trading volumes. |
| US-China Trade Relations | Recent tariff rollback eased tensions, pressuring gold. | Highly sensitive to news. Further de-escalation would likely be bearish for gold; renewed tensions could be bullish. | Official announcements on tariffs, progress of trade negotiations. |
| Federal Reserve & USD | Current hawkish Fed stance contributing to a stronger USD. | Continued USD strength acts as a headwind for gold. Any hints of a dovish policy shift would be supportive. | Federal Reserve statements, inflation data (CPI, PPI), employment reports. |
| Global Economic Sentiment | Cautious optimism in markets, with reduced immediate recession fears. | A shift towards risk-off sentiment would be bullish for gold. Sustained market optimism could be bearish. | VIX index, major global economic data releases (GDP, PMI), geopolitical developments. |
| Central Bank Activity | Consistent gold purchases reported from some central banks (e.g., PBoC). | Provides underlying support and may limit significant downside price movements. | Official reports on central bank gold reserves and purchases. |
Video Analysis: Expert Insights on Gold's Next Moves
For a visual perspective on gold's price action and forecast for the coming week, the following video offers expert analysis. It delves into critical support and resistance levels, potential market reversals, and provides insights relevant to traders and investors tracking XAU/USD movements for mid-May 2025.
This analysis specifically covers the period of May 12-16, 2025, aligning closely with the short-term outlook discussed. It explores technical setups and market sentiment that could dictate gold's direction in the immediate future.
Frequently Asked Questions (FAQ)
What are the main drivers for gold's price in the short term?
In the next few days or weeks, gold prices will primarily be influenced by:
- US Dollar Strength: A stronger dollar generally makes gold more expensive for other currency holders, reducing demand.
- Federal Reserve Policy: Expectations around interest rate changes and inflation control measures significantly impact gold.
- Geopolitical Events: Increased global uncertainty or instability tends to boost gold's safe-haven appeal.
- US-China Trade Dynamics: News regarding trade tensions or resolutions can cause market sentiment shifts affecting gold.
- Economic Data Releases: Key indicators like inflation (CPI), employment reports, and GDP growth influence investor outlook and gold demand.
What do technical indicators currently suggest for gold?
Technical indicators present a mixed picture:
- The Relative Strength Index (RSI) shows a bearish divergence, indicating potential overbought conditions and waning upward momentum.
- The Moving Average Convergence Divergence (MACD) is declining within the positive zone, signaling weakening trend strength but not a full bearish reversal.
- The Money Flow Index (MFI) suggests active liquidity inflow and dominant long positions, offering some support.
- Doji candlestick patterns near recent highs point to market indecision. Key support is around $3,200, with resistance near $3,300-$3,350.
How do US-China trade relations affect gold?
US-China trade relations are a significant factor. When tensions escalate (e.g., new tariffs announced), global economic uncertainty increases, often boosting demand for gold as a safe-haven asset, causing its price to rise. Conversely, when relations improve or agreements are reached (like the recent 90-day tariff rollback), market optimism grows, reducing gold's appeal and potentially leading to price declines. The ongoing nature of these negotiations means gold prices can be quite sensitive to related news.
Is gold expected to be volatile in the coming weeks?
Yes, gold prices are likely to experience volatility in the next few days and weeks. This is due to the confluence of mixed technical signals, ongoing sensitivity to macroeconomic news (especially regarding US-China trade and Fed policy), and fluctuating investor sentiment. Price predictions suggest a potential trading range, for example, between approximately $3,100 and $3,350, highlighting the expectation of price swings.
Recommended Further Exploration
- Explore how Federal Reserve interest rate policy might impact gold prices throughout 2025.
- Investigate the role of central bank gold purchases in shaping the current market environment.
- Discover the detailed technical analysis outlook for XAU/USD over the next month.
- Learn more about the impact of key US economic data releases on gold price fluctuations.
References
Last updated May 13, 2025