
Unveiling the Visual Power of Two-Circle Venn Diagrams: A Graphical Exploration
Discover how these simple overlapping circles offer profound insights into relationships, comparisons, and logical structures.
A two-circle Venn diagram is a widely recognized graphical tool that employs two overlapping circles to visually represent the logical relationships, similarities, and differences between two distinct sets of items, concepts, or data. This elegant visual method provides an intuitive way to understand complex comparisons at a glance, making it invaluable across various disciplines.
Key Insights at a Glance
- Visual Comparison: Two-circle Venn diagrams excel at graphically showcasing commonalities (in the overlapping section) and unique attributes (in the non-overlapping sections) of two distinct sets.
- Conceptual Clarity: They offer a clear and intuitive method for understanding set theory concepts such as intersection, union, and differences, without requiring deep mathematical knowledge.
- Versatile Application: These diagrams are highly versatile, finding use in education for comparing texts, in business for market analysis, and in logic for visualizing propositions.
Deconstructing the Two-Circle Venn Diagram: A Graphical Perspective
From a graphical standpoint, the power of a two-circle Venn diagram lies in its simplicity and the immediate clarity it brings to comparing two entities. The visual structure is designed for intuitive understanding, leveraging basic geometric shapes to convey complex relationships.
Core Visual Components
The effectiveness of a two-circle Venn diagram is rooted in its distinct graphical components, each serving a specific purpose in illustrating the relationships between the sets.
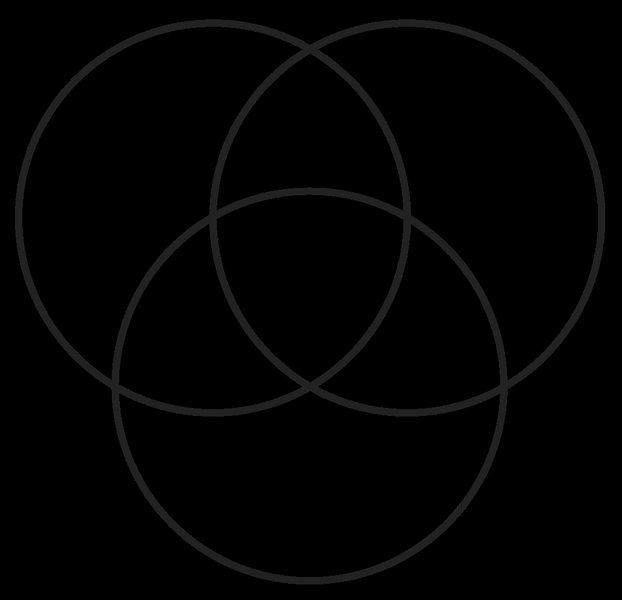
A standard two-circle Venn diagram illustrating the basic structure for comparing two sets.
Circles as Set Representations
Each of the two circles visually represents a distinct set. A set can be any collection of items, ideas, characteristics, or data points that share a common property. For example, one circle might represent "Mammals" and the other "Animals that Can Fly."
The Intersection: Shared Attributes
The most crucial graphical element is the overlapping area where the two circles intersect. This region, known as the intersection, visually signifies the elements, characteristics, or data points that are common to both sets. In our "Mammals" and "Animals that Can Fly" example, "Bats" would be placed in this overlapping section.
Non-Overlapping Regions: Unique Attributes
The portions of each circle that do not overlap with the other represent the elements unique to that specific set. These areas highlight the differences between the two sets. For instance, "Whales" would be in the unique part of the "Mammals" circle, and "Eagles" would be in the unique part of the "Animals that Can Fly" circle (assuming the "Mammals" circle is not encompassing all characteristics of mammals other than flight).
The Universal Set (Optional Frame)
Often, though not always explicitly drawn in simple two-set diagrams, the circles are considered to exist within a larger rectangle representing the "universal set." This universal set encompasses all elements relevant to the context of the diagram. For instance, if comparing "Fruits" and "Red-colored Foods," the universal set might be "All Food Items."
A Brief Historical Glimpse
While the modern Venn diagram is named after John Venn, who popularized their use in 1880, the concept of using diagrams to represent logical relationships has earlier roots. Gottfried Wilhelm von Leibnitz in the late 17th century and Leonhard Euler in the 18th century used similar graphical methods. Euler diagrams, in particular, are considered direct forerunners, visually representing set relationships. John Venn refined and formalized this approach, creating the diagrams widely used today.
How Two-Circle Venn Diagrams Work Visually
The genius of the Venn diagram lies in its ability to translate abstract logical relationships into a tangible, visual format. This graphical translation allows for quick comprehension and analysis.
Highlighting Similarities
The visual emphasis on the overlapping area immediately draws the eye to what is shared between the two sets. The size of this intersection, though not always strictly proportional in informal diagrams, can give a qualitative sense of the degree of overlap or commonality.
Emphasizing Differences
Conversely, the distinct, non-overlapping segments clearly delineate the unique aspects of each set. This visual separation aids in contrasting the two subjects effectively.
Illustrating Logical Connections
By visually mapping elements to specific regions (unique to A, unique to B, or common to A and B), the diagram serves as a graphical representation of logical statements. For example, it can illustrate concepts from Boolean logic such as AND (the intersection) and XOR (the unique portions).
Crafting Your Own Two-Circle Venn Diagram
Creating a two-circle Venn diagram can be a simple manual process or a task aided by various digital tools, each offering different levels of customization and features.
Manual Creation
The most straightforward method involves pen and paper:
- Draw Two Overlapping Circles: Sketch two circles that intersect, ensuring the overlapping area is large enough to write in.
- Identify and Label Sets: Clearly define what each circle represents (e.g., Set A: "Renewable Energy Sources," Set B: "Cost-Effective Energy Sources"). Label each circle accordingly.
- Populate the Intersection: List items or characteristics common to both sets in the overlapping region. (e.g., "Solar Power" if it's considered both renewable and becoming cost-effective).
- Populate Unique Areas: List items or characteristics unique to each set in their respective non-overlapping portions. (e.g., "Geothermal" might be in renewable but perhaps not always cost-effective initially, while "Natural Gas" might be cost-effective but not renewable).
Digital Creation Tools
Numerous software applications and online platforms facilitate the creation of polished Venn diagrams:
- Microsoft 365 (Word, PowerPoint, Excel): Utilizes SmartArt graphics, offering pre-designed Venn diagram templates that can be easily customized.
- Dedicated Diagramming Software: Tools like Lucidchart, SmartDraw, Gliffy, Creately, and draw.io provide intuitive interfaces, templates, and advanced customization options (colors, fonts, shapes).
- Mind Mapping Tools: Software like MindManager allows for the creation of Venn diagrams and the integration of additional elements such as notes, images, and documents.
- Online Venn Diagram Makers: Many websites offer free or subscription-based tools specifically for generating Venn diagrams quickly.
These digital tools often allow for easy editing of circle colors, border styles, text formatting, and precise positioning of elements, enhancing the visual appeal and clarity of the diagram.
Visualizing Applications: The Versatility of Two-Circle Venn Diagrams
The straightforward graphical nature of two-circle Venn diagrams makes them incredibly versatile across numerous fields. They simplify complex comparisons and highlight key relationships, making information more accessible and understandable.
This video, "Learn Venn Diagrams In 7 min," offers a concise introduction to Venn diagrams, covering their basic structure and how they represent intersections of sets, which is fundamental to understanding their graphical power.
Comparative Analysis in Education and Research
In educational settings, Venn diagrams are a staple for compare-and-contrast exercises. Students might use them to analyze characters in literature, historical events, scientific theories, or even different artistic styles. The visual separation of shared and unique traits aids in structuring thoughts and arguments.
Example: Comparing Two Novels
- Circle 1 (Novel X): Unique plot points, specific characters, distinct writing style.
- Circle 2 (Novel Y): Different unique plot points, its own set of characters, alternative stylistic choices.
- Intersection: Shared themes (e.g., "coming of age," "social justice"), common literary devices used, or similar historical settings.
Strategic Insights in Business and Marketing
Businesses frequently employ Venn diagrams for strategic planning and market analysis. They can be used to compare competitor offerings, identify overlapping customer segments, or find the sweet spot where market needs and company strengths intersect.
Example: Product Feature Comparison
- Circle 1 (Our Product): Unique selling propositions, features exclusive to our offering.
- Circle 2 (Competitor's Product): Features unique to the competitor.
- Intersection: Standard industry features, customer needs addressed by both products.
Logical Reasoning and Set Theory
In mathematics and logic, Venn diagrams provide a visual foundation for understanding set theory. They illustrate concepts such as:
- Intersection (A ∩ B): The overlapping area.
- Union (A ∪ B): All areas covered by both circles, including the overlap.
- Difference (A \ B or A - B): The part of circle A that does not overlap with B.
- Complement (A'): Everything outside of circle A (within the universal set).
Data Organization and Problem Solving
Venn diagrams can help organize information from surveys or data sets. For example, if surveying preferences for two different products, a Venn diagram can quickly show how many people like only product A, only product B, both, or neither (if a universal set is considered).
Effectiveness of Two-Circle Venn Diagrams Across Applications
While simple, the two-circle Venn diagram's effectiveness varies slightly depending on the complexity and nature of the application. The following radar chart provides an opinionated perspective on its utility in different domains. The scores (out of 10) reflect how well the diagram typically serves its primary purpose in that area, with higher scores indicating greater effectiveness for conveying information graphically.
Radar chart illustrating the perceived effectiveness of two-circle Venn diagrams in various applications.
This chart suggests that two-circle Venn diagrams are highly effective for straightforward comparisons and illustrating fundamental logical relationships, particularly in educational contexts and basic set theory. Their effectiveness might be slightly less for highly complex business analyses that require more variables, though they still serve as an excellent initial visualization tool.
Key Components and Relationships: A Mindmap View
To further solidify the graphical understanding of a two-circle Venn diagram, the following mindmap illustrates its core components and how they relate to the overall concept of comparing two sets. This visual breakdown emphasizes the distinct roles of each part of the diagram.
(Graphical Perspective)"] id1["Set A (Circle 1)"] id1a["Represents first group/concept"] id1b["Unique Elements of A
(Non-overlapping part)"] id2["Set B (Circle 2)"] id2a["Represents second group/concept"] id2b["Unique Elements of B
(Non-overlapping part)"] id3["Intersection (A ∩ B)"] id3a["Overlapping Area"] id3b["Common Elements
Shared by Set A and Set B"] id4["Visual Purpose"] id4a["Compare & Contrast"] id4b["Show Similarities"] id4c["Show Differences"] id4d["Illustrate Logical Relationships"] id5["Optional Context"] id5a["Universal Set (U)
Often a surrounding rectangle"]
Mindmap detailing the structure and purpose of a two-circle Venn diagram's graphical elements.
This mindmap provides a hierarchical view, starting from the overall diagram and branching out to its constituent parts and their functions. It reinforces how the graphical arrangement of circles and their overlap directly translates to the logical comparison of the sets they represent.
Understanding the Graphical Elements: A Summary Table
The following table summarizes the key graphical components of a two-circle Venn diagram and their primary interpretive meaning. This provides a quick reference for understanding what each part of the visual represents.
| Graphical Component | Visual Description | Interpretation / Meaning | Primary Function |
|---|---|---|---|
| Circle 1 (Set A) | A complete circular area. | Represents all elements belonging to the first set. | Define the scope of the first entity. |
| Circle 2 (Set B) | A second complete circular area, typically overlapping with the first. | Represents all elements belonging to the second set. | Define the scope of the second entity. |
| Overlapping Region (Intersection) | The area where Circle 1 and Circle 2 physically overlap. | Elements common to both Set A and Set B. Represents "A AND B". | Highlight similarities, shared characteristics. |
| Non-Overlapping Part of Circle 1 | The segment of Circle 1 that does not intersect with Circle 2. | Elements unique to Set A (present in A but NOT in B). | Highlight differences, unique attributes of Set A. |
| Non-Overlapping Part of Circle 2 | The segment of Circle 2 that does not intersect with Circle 1. | Elements unique to Set B (present in B but NOT in A). | Highlight differences, unique attributes of Set B. |
| Universal Set (Optional Rectangle) | A rectangle drawn around both circles. | Represents all possible elements under consideration in the given context. | Provide context and define the boundary for complements. |
This table reinforces how each visual aspect of the diagram contributes to its overall function of clearly and concisely communicating the relationships between two sets.
Frequently Asked Questions (FAQ)
What is the main graphical advantage of a two-circle Venn diagram?
Its main graphical advantage is its simplicity and intuitive nature. The overlapping circles provide an immediate visual representation of similarities (in the overlap) and differences (in the non-overlapping parts), making complex comparisons easy to grasp quickly without requiring specialized knowledge.
Can the size of the circles or the overlap in a Venn diagram represent quantities?
In standard Venn diagrams, the size of the circles and the overlapping area are generally schematic and not strictly proportional to the number of elements they contain. Their primary purpose is to show logical relationships. However, area-proportional Venn diagrams (Euler diagrams are often area-proportional) do exist where the size of the regions is scaled to represent quantities, but these are more complex to draw accurately.
How is a two-circle Venn diagram different from an Euler diagram?
A Venn diagram always shows all possible logical relations between sets (all overlaps are shown, even if a region is empty). An Euler diagram, on the other hand, only shows the actual relationships that exist; if there is no intersection between two sets, the circles will not overlap. For two sets, if there's an intersection, they look similar, but Euler diagrams can also show one circle entirely within another (subset) or two completely separate circles (disjoint sets) without an explicit overlap region if no common elements exist.
What are some common mistakes to avoid when creating a Venn diagram from a graphical perspective?
Common mistakes include making the overlapping area too small to write in legibly, unclear labeling of the sets or regions, inconsistent use of colors or shading that might confuse the viewer, and misplacing elements (e.g., putting a shared element in a unique section). Ensuring clarity and accuracy in the graphical representation is key.
Recommended Further Exploration
- How can three-circle Venn diagrams be used for more complex comparisons?
- What are the specific applications of Venn diagrams in probability theory?
- Explore the differences and similarities between Venn diagrams and Euler diagrams in detail.
- Discover advanced digital tools for creating interactive and data-driven Venn diagrams.
References
Last updated May 15, 2025