
Unlocking Clarity: Your Comprehensive Guide to Crafting Impactful Workflow Slides
Visually map out any process with ease, from simple sequences to complex operations, for compelling presentations.
Key Insights for Effective Workflow Visualization
- Versatile Tooling: Leverage built-in features like PowerPoint's SmartArt or Google Slides' diagram tools for quick creation, or opt for specialized software for more complex needs.
- Template Power: Utilize readily available online templates to accelerate your design process and ensure a professional, polished look for your workflow diagrams.
- Clarity is King: Prioritize a clear, logical flow with concise labels and consistent visual language to make your workflow easily understandable at a glance.
Understanding Workflow Slides: The Visual Blueprint of Processes
A workflow slide is a visual representation of a sequence of steps, tasks, or decisions involved in a particular process. Whether it's for a business operation, a project plan, or a software development lifecycle, a well-designed workflow slide can transform complex information into an easy-to-understand visual narrative. It helps to clarify roles, identify bottlenecks, streamline operations, and ensure everyone is on the same page. Since you haven't specified the particular steps for your workflow, this guide will provide a comprehensive overview of how to create an effective workflow slide that you can adapt to your specific needs.
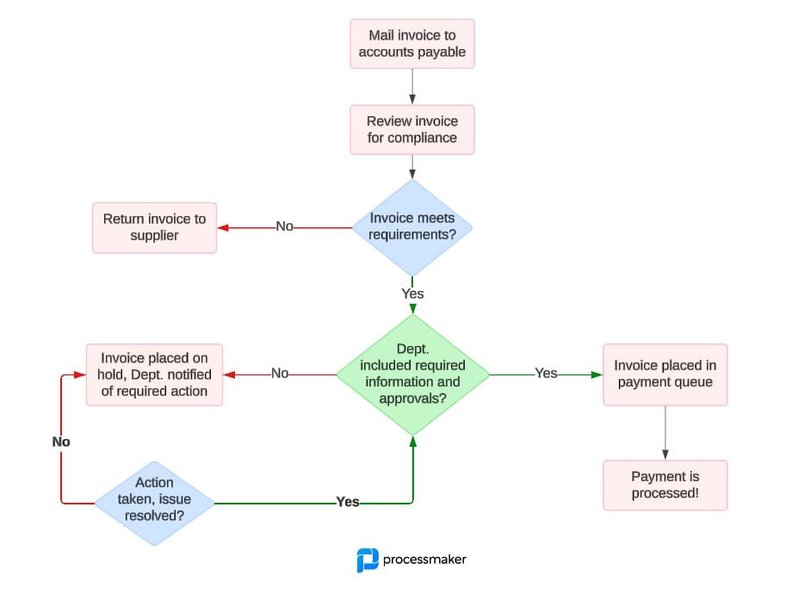
Visualizing the flow of tasks and decisions is key to understanding and optimizing processes.
Effectively designed workflow slides serve multiple purposes: they can be used for training, process documentation, decision-making meetings, and project status updates. The goal is always to communicate the process clearly and efficiently.
Choosing Your Path: Methods for Creating Workflow Slides
Several methods and tools are available for creating workflow slides, each with its own set of advantages. Your choice will likely depend on the complexity of your workflow, the level of customization required, and your familiarity with different software.
Native Presentation Software Tools
Most presentation software like Microsoft PowerPoint and Google Slides offer built-in capabilities for creating basic to moderately complex workflow diagrams.
PowerPoint SmartArt
PowerPoint's SmartArt feature is a popular choice for quickly creating visually appealing process diagrams. You can find it under the "Insert" tab. SmartArt provides various pre-designed layouts (e.g., "Basic Flowchart," "Picture Accent Process") that you can easily populate with your steps. It allows for quick color changes and style adjustments to match your presentation theme.
PowerPoint/Google Slides Shapes and Connectors
For more tailored or intricate workflows, manually adding and connecting shapes (rectangles for tasks, diamonds for decisions, arrows for flow) offers greater flexibility. In PowerPoint, access shapes via "Insert" > "Shapes." Google Slides offers similar functionality through its "Insert" > "Shape" and "Insert" > "Line" options. This method gives you full control over the placement, size, and appearance of each element.
Leveraging Pre-Designed Templates
Numerous websites (e.g., SlideModel, SlideTeam, PresentationGO) offer a vast collection of free and premium workflow templates for both PowerPoint and Google Slides. These templates come in various styles, such as chevron segments, circular diagrams, step diagrams, and even complex zigzag layouts. Using a template can save significant time and effort, providing a professional design foundation that you can customize with your specific steps.
Dedicated Diagramming Software
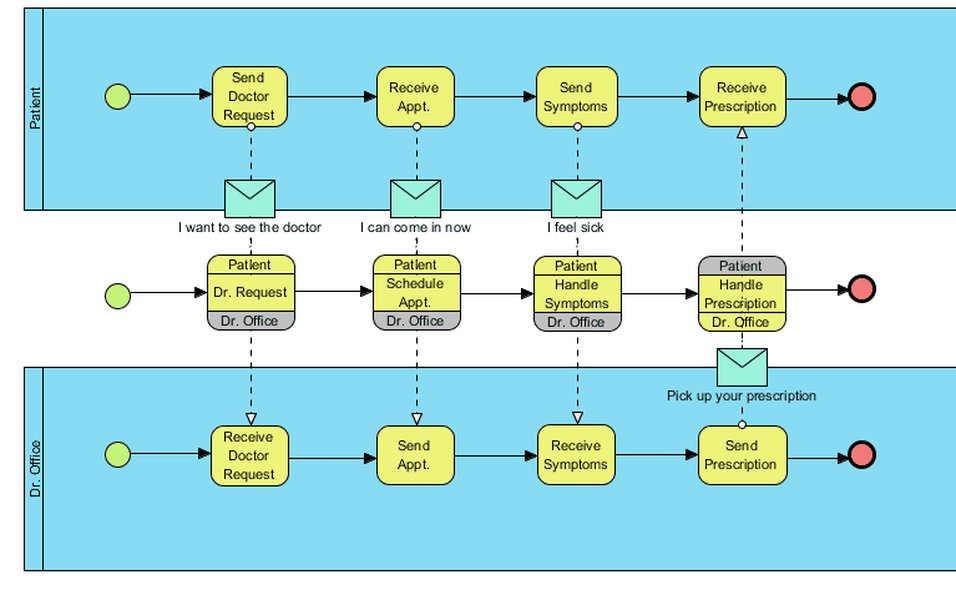
For highly complex workflows or when advanced diagramming features are needed, dedicated tools like Microsoft Visio, Lucidchart, EdrawMax, or Canva can be invaluable. These tools often provide extensive libraries of shapes and symbols, advanced layout options (like swimlanes), collaboration features, and the ability to export diagrams in various formats, including images or directly into PowerPoint presentations. EdrawMax, for example, supports adding hyperlinks and attachments to diagrams.
Comparative Analysis of Workflow Creation Methods
Selecting the right method to create your workflow slide depends on various factors such as complexity, time constraints, and desired level of customization. The radar chart below provides a visual comparison of common approaches based on key attributes. A higher score (further from the center) indicates better performance in that category. For 'Ease of Learning,' a higher score means the tool is easier to learn (i.e., has a gentler learning curve).
This chart helps illustrate the trade-offs: SmartArt and templates offer speed and ease for simpler tasks, while manual shapes and dedicated tools provide greater customization for complex diagrams, often with a steeper learning curve (represented inversely as 'Ease of Learning' where higher scores indicate it is easier to learn).
Your Blueprint: Step-by-Step to a Polished Workflow Slide
While you haven't provided specific steps for your workflow, this guide will walk you through the general process of creating an effective workflow slide. You can adapt these instructions to visualize any sequence of tasks or decisions.
1. Define and Outline Your Workflow Steps
Before you start designing, clearly list all the steps in your process from beginning to end. Identify any decision points, parallel tasks, or loops. For example, if creating a project workflow, your outline might include: Initiation, Planning, Execution, Monitoring, and Closure. Having a clear, sequential list is crucial.
A clear outline of steps is the foundation of an effective workflow diagram.
2. Open Your Presentation Software and Add a New Slide
Start by opening Microsoft PowerPoint or Google Slides and adding a new, blank slide to your presentation, or open the specific slide where you want to place the workflow diagram.
3. Choose Your Creation Method and Insert Elements
Based on your preference and the complexity of your workflow, select one of the methods discussed earlier:
Using SmartArt (PowerPoint)
Go to the "Insert" tab, click "SmartArt," and choose a suitable graphic from the "Process" or "Hierarchy" categories. Once inserted, a text pane will appear, allowing you to type your workflow steps directly into the graphic.
Using Shapes and Connectors (PowerPoint/Google Slides)
Go to "Insert" > "Shapes." Select standard flowchart shapes (e.g., rectangles for processes, ovals for start/end points, diamonds for decisions). Click and drag on the slide to draw them. Use line or arrow shapes to connect them, indicating the direction of flow. The Ctrl + D shortcut can be useful for quickly duplicating shapes.
Using a Template
If you've downloaded a template, open it in PowerPoint or Google Slides. The template will have pre-designed shapes and placeholders that you can modify to fit your specific workflow steps.
4. Add Text and Descriptions
Click on each shape (or use the SmartArt text pane) to add concise descriptions of each step. If more detail is needed, consider using smaller text boxes near the shapes or speaker notes, rather than cluttering the diagram itself.
5. Connect the Shapes Logically
Use arrows to clearly show the sequence and direction of the workflow. Ensure that connectors attach properly to the shapes. For decision points (diamonds), you'll typically have at least two outgoing arrows (e.g., "Yes" and "No").
6. Customize Appearance for Clarity and Impact
Adjust colors, fonts, shape styles, and line weights to enhance readability and visual appeal. In PowerPoint, the "Shape Format" and "SmartArt Design" tabs offer extensive customization options. Aim for consistency in your design choices. Ensure there is enough contrast between text and background colors.
Mapping Success: Key Elements of an Effective Workflow Slide
Creating an impactful workflow slide involves more than just connecting shapes. It requires careful consideration of various elements to ensure your message is clear, engaging, and achieves its purpose. The mindmap below illustrates the core components and considerations for designing a successful workflow visualization.
Sufficient White Space"] id2["Visual Appeal & Engagement"] id2a["Consistent Design (Colors, Fonts, Shapes)"] id2b["Use of Icons/Symbols (Optional & Relevant)"] id2c["Appropriate Shape Choices for Meaning"] id2d["Balanced Layout on Slide"] id3["Content Accuracy & Completeness"] id3a["Correct Sequence of All Steps"] id3b["Accurate Representation of Decision Points & Branches"] id3c["Inclusion of All Necessary Information (without overload)"] id4["Audience Consideration"] id4a["Tailor Level of Detail to Audience Knowledge"] id4b["Understand Audience's Purpose (Inform, Train, Decide)"] id4c["Ensure Readability from Viewing Distance"] id5["Tool Proficiency & Choice"] id5a["Selecting the Right Tool for Complexity & Desired Output"] id5b["Leveraging Tool Features Effectively"] id5c["Focus on Efficiency in Creation"] id6["Purpose & Objective Alignment"] id6a["What key message should the audience take away?"] id6b["Does the workflow clearly support the presentation's goal?"]
This mindmap emphasizes that a successful workflow slide harmoniously blends clear, accurate information with engaging visuals, all tailored to the specific audience and the overarching objectives of the presentation.
Illustrative Workflow: A Generic Project Lifecycle Example
To help you visualize how steps translate into a workflow, here’s a generic 10-stage process. You can adapt this structure or create your own based on the specific process you need to illustrate, using fewer or more steps as required.
- Step 1: Planning - Description: Define project goals, scope, deliverables, and objectives.
- Step 2: Design - Description: Create a detailed design, blueprint, or prototype of the solution.
- Step 3: Development/Creation - Description: Build or develop the core components of the project or process.
- Step 4: Testing - Description: Conduct thorough testing, quality assurance, and debugging.
- Step 5: Review & Feedback - Description: Present to stakeholders for review and gather feedback.
- Step 6: Revision/Improvement - Description: Incorporate feedback and make necessary adjustments or improvements.
- Step 7: Implementation/Deployment - Description: Roll out or deploy the final solution or system.
- Step 8: Monitoring/Launch - Description: Monitor performance post-launch and manage initial operations.
- Step 9: Maintenance & Support - Description: Perform ongoing maintenance, updates, and provide user support.
- Step 10: Evaluation & Refinement - Description: Continuously evaluate outcomes, gather lessons learned, and refine the process for future iterations.
These steps can be visually represented using shapes like rectangles for tasks and diamonds for decision points (if any), all connected by arrows to clearly indicate the flow from one stage to the next.
Workflow charts can use varied shapes and colors to denote different types of actions or stages.
Weighing Your Options: Comparing Workflow Creation Tools
The choice of tool or method for creating your workflow slide can significantly impact the process and outcome. This table summarizes the primary advantages and disadvantages of common approaches:
| Method/Tool | Pros | Cons |
|---|---|---|
| PowerPoint SmartArt | Quick to insert basic process flows; good integration with PowerPoint; pre-set styles and color themes; minimal learning curve. | Limited customization options for complex flows; can look generic if not modified; not ideal for very non-linear or intricate workflows. |
| Manual Shapes & Connectors (PowerPoint/Google Slides) | High degree of customization for shapes, lines, colors, and layout; allows for unique and complex diagrams tailored to specific needs. | Can be time-consuming to create and perfectly align elements; requires more design effort and skill to look professional; maintaining consistency can be challenging. |
| Online Workflow Templates | Saves significant time with pre-designed, often professional layouts; wide variety of styles available; ensures a polished look quickly. | May require purchase for premium or more unique templates; customization might be limited by the template's inherent structure; finding the 'perfect' template can take time. |
| Dedicated Diagramming Software (e.g., EdrawMax, Lucidchart, Visio) | Advanced features (e.g., data linking, swimlanes, industry-specific symbols, automated layouts); powerful customization; often supports real-time collaboration and export to numerous formats. | May have a steeper learning curve; often subscription-based or requires software purchase; might be overkill for simple, infrequent workflow diagrams. |
| Google Slides Diagrams/Shapes | Free and web-based, facilitating easy sharing and collaboration; simple interface for creating basic diagrams quickly. | Fewer advanced features compared to PowerPoint or dedicated tools; customization options are more limited; can be less efficient for highly complex diagrams. |
Consider the complexity of your workflow, your available time, budget, technical skills, and the level of visual polish required when making your decision.
Watch and Learn: Creating Flowcharts in PowerPoint
Visual learners might find a video tutorial helpful. The following video demonstrates how to create a 5-step flowchart slide in PowerPoint, offering practical tips you can apply to your own workflow presentation. It covers using shapes, connecting them, and adding text to build a clear process diagram, which are fundamental skills for creating any workflow slide.
This tutorial can give you a good starting point for using PowerPoint's tools to design your workflow, particularly if you prefer the control offered by the manual shapes and connectors method discussed earlier.
Frequently Asked Questions (FAQ)
What's the simplest way to start creating a workflow slide?
How can I make my workflow visually engaging?
Are there any common pitfalls to avoid when designing a workflow?
When should I consider using a dedicated diagramming tool instead of PowerPoint/Google Slides?
Explore Further
Deepen your understanding and skills in creating effective visual process documentation with these related topics:
- Explore advanced customization options for SmartArt in PowerPoint.
- Discover best practices for designing complex decision-based flowcharts.
- Find top-rated online tools for collaborative workflow diagramming.
- Learn how to animate workflow steps in a presentation for better engagement.
References
Last updated May 19, 2025