
Hamada Equation Explained
Understanding Financial Leverage and Its Impact on Risk
Key Takeaways
- Financial leverage significantly influences a company's risk profile by altering its beta.
- The Hamada Equation quantifies the relationship between levered and unlevered beta.
- Proper application of the Hamada Equation aids in optimal capital structure decisions.
Introduction to the Hamada Equation
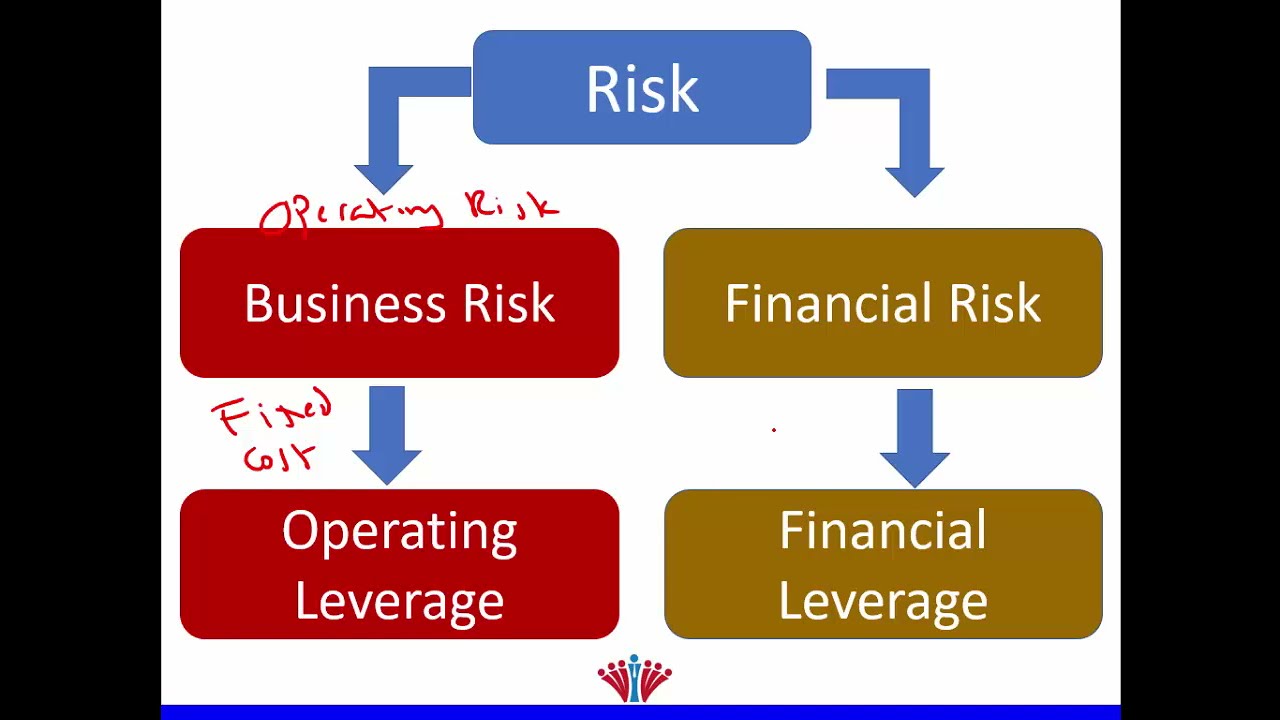
In the realm of corporate finance, understanding the interplay between a firm's capital structure and its risk is paramount. The Hamada Equation serves as a pivotal tool in this analysis, providing insights into how financial leverage—specifically the use of debt—affects a company's systematic risk, as measured by its beta. By distinguishing between business risk and financial risk, the Hamada Equation enables analysts and investors to evaluate the true risk profile of a company based on its capital structure.
Understanding Beta in Financial Context
Beta (β) is a measure of a stock's volatility in relation to the overall market. It quantifies the tendency of an investment's returns to respond to swings in the market. A beta of 1 indicates that the stock's price will move with the market, a beta greater than 1 signifies higher volatility than the market, and a beta less than 1 implies lower volatility.
There are two primary types of beta:
- Unlevered Beta (βU): Reflects the company's business risk without considering its capital structure. It represents the risk inherent to the company's operations.
- Levered Beta (βL): Accounts for both business and financial risk, representing the risk of the company with its current capital structure, including debt.
Financial Leverage and Its Importance
Financial leverage refers to the use of debt financing in a company's capital structure. While leveraging can amplify returns on equity, it also increases the company's financial risk. The extent of leverage is typically measured by the Debt-to-Equity (D/E) ratio, which compares the company's total debt to its shareholders' equity.
The balance between debt and equity financing is crucial. Excessive debt can lead to financial distress and potentially bankruptcy, especially if the company faces periods of low earnings or economic downturns. Conversely, under-leveraging might result in missed opportunities for growth and expansion due to limited available capital.
The Hamada Equation Formula
Mathematical Representation
The Hamada Equation establishes a relationship between the levered and unlevered beta of a company, incorporating the effects of financial leverage. The formula is expressed as:
\[ \beta_L = \beta_U \times [1 + (1 - T) \times \frac{D}{E}] \]Where:
\[ \beta_L = \text{Levered Beta} \] \[ \beta_U = \text{Unlevered Beta} \] \[ T = \text{Corporate Tax Rate} \] \[ \frac{D}{E} = \text{Debt-to-Equity Ratio} \]Variables Explained
Levered Beta (βL): This represents the company's systematic risk considering its current debt level. It indicates how sensitive the company's equity is to market movements.
Unlevered Beta (βU): This denotes the company's inherent business risk, independent of its capital structure. It reflects the risk of the company's assets and operations.
Corporate Tax Rate (T): The effective tax rate applicable to the company. Interest payments on debt are tax-deductible, thus the tax rate plays a role in the valuation.
Debt-to-Equity Ratio (D/E): This ratio measures the proportion of debt and equity in the company's capital structure. A higher D/E ratio indicates greater leverage and higher financial risk.
Worked-Out Example
Given Data
| Parameter | Value |
|---|---|
| Unlevered Beta (βU) | 0.75 |
| Corporate Tax Rate (T) | 33% |
| Debt (D) | $100 million |
| Equity (E) | $150 million |
| Debt-to-Equity Ratio (D/E) | 0.6667 |
Step-by-Step Calculation
- Insert the Values into the Hamada Equation: \[ \beta_L = \beta_U \times [1 + (1 - T) \times \frac{D}{E}] \] Substituting the given values: \[ \beta_L = 0.75 \times [1 + (1 - 0.33) \times 0.6667] \]
- Calculate (1 - T): \[ 1 - T = 1 - 0.33 = 0.67 \]
- Multiply (1 - T) by D/E: \[ 0.67 \times 0.6667 = 0.4467 \]
- Add 1 to the Result from Step 3: \[ 1 + 0.4467 = 1.4467 \]
- Multiply the Unlevered Beta by the Result from Step 4: \[ \beta_L = 0.75 \times 1.4467 = 1.0850 \]
Interpretation of Results
The levered beta (\(\beta_L\)) calculated is approximately 1.0850. This indicates that the company's equity is slightly more volatile than the market. A beta greater than 1 suggests that the company is more sensitive to market movements due to its financial leverage. Specifically, the addition of debt has increased the company's systematic risk from its unlevered beta of 0.75 to a levered beta of 1.0850.
Investors may interpret this as the company having a higher potential for returns in favorable market conditions but also facing increased risk during market downturns. This heightened risk profile must be weighed against the benefits of debt financing, such as tax shields and increased return on equity.
Implications of the Hamada Equation
Capital Structure Decisions
The Hamada Equation is instrumental in determining the optimal capital structure for a company. By quantifying how debt influences the company's beta, managers can assess the trade-offs between debt and equity financing. A balanced approach ensures that the company leverages debt to enhance returns without disproportionately increasing financial risk.
For instance, if increasing debt leads to a manageable rise in beta, the company might benefit from the tax advantages of debt. However, if the resultant levered beta becomes excessively high, it may signal increased risk, potentially leading to higher costs of equity and financial distress.
Risk Management
Understanding the relationship between debt and beta assists in effective risk management. By maintaining an optimal D/E ratio, companies can control their systematic risk exposure. This balance is essential for sustaining investor confidence and ensuring long-term financial stability.
Additionally, the Hamada Equation allows companies to simulate various capital structures and their impact on beta, facilitating proactive adjustments to mitigate undue risk.
Investor Assessment
Investors rely on beta as a critical component in the Capital Asset Pricing Model (CAPM) to estimate expected returns. A precise calculation of levered beta using the Hamada Equation provides investors with a clearer picture of the risk associated with a company's equity.
This informed assessment aids investors in making strategic decisions regarding portfolio diversification, risk tolerance, and expected returns.
Advanced Considerations
Assumptions and Limitations
While the Hamada Equation is a valuable tool, it operates under certain assumptions that may limit its applicability:
- Constant Debt-to-Equity Ratio: The equation assumes that the D/E ratio remains constant, which may not hold true in dynamic market conditions.
- Tax Rate Stability: It presumes a stable corporate tax rate, which can fluctuate due to changes in tax laws and regulations.
- Market Efficiency: The formula relies on the Efficient Market Hypothesis, assuming that markets are efficient and all information is accurately reflected in stock prices.
- No Financial Distress Costs: It neglects the potential costs associated with high levels of debt, such as bankruptcy costs and agency problems.
Recognizing these limitations is essential for accurate application and interpretation of the Hamada Equation in real-world scenarios.
Extensions of the Hamada Equation
To address some of its limitations, the Hamada Equation can be extended or modified. For example:
-
Incorporating Financial Distress Costs: Adjustments can be made to account for the costs associated with high leverage, providing a more comprehensive risk assessment.
-
Dynamic Capital Structures: Models can incorporate variable D/E ratios to reflect changing financing strategies over time.
-
Integrating Market Fluctuations: Including variables that capture market volatility can enhance the equation's responsiveness to economic conditions.
These extensions facilitate a more nuanced analysis, allowing for tailored applications across diverse financial landscapes.
Conclusion
The Hamada Equation serves as a cornerstone in financial analysis, bridging the gap between a company's capital structure and its inherent risk. By elucidating the relationship between levered and unlevered beta, it empowers managers, investors, and analysts to make informed decisions regarding financing strategies and risk management. While it operates under certain assumptions, its foundational insights remain invaluable for navigating the complexities of financial leverage in corporate finance.
References
Last updated February 4, 2025