
HEART vs. The Rest: Choosing Your North Star for UX Measurement
A deep dive into how Google's HEART framework stacks up against other popular methods for evaluating user experience.
Understanding how users interact with and feel about your product is crucial for success. Various frameworks exist to measure User Experience (UX), each offering different perspectives and metrics. Google's HEART framework provides a holistic view, but how does it compare to alternatives like AARRR, SUS, or CX Index? Let's explore their strengths, weaknesses, and ideal use cases.
Key Insights at a Glance
- HEART offers a balanced, user-centric view: It uniquely combines attitudinal (Happiness) and behavioral (Engagement, Adoption, Retention, Task Success) metrics for a comprehensive understanding of UX.
- Alternative frameworks have different focuses: AARRR/RARRA prioritize business growth and customer lifecycle funnels, SUS measures perceived usability specifically, and CX Index provides a high-level satisfaction score.
- Context is key for selection: The best framework depends on your goals – HEART excels for improving product UX, AARRR for tracking growth, SUS for quick usability checks, and CX Index for overall customer sentiment benchmarking.
Unpacking the HEART Framework
What is HEART?
Developed by Google researchers, the HEART framework provides a structured approach to measuring the quality of user experience at scale. It breaks down UX into five key categories, encouraging teams to define specific goals, identify relevant user actions (signals), and track concrete metrics for each.
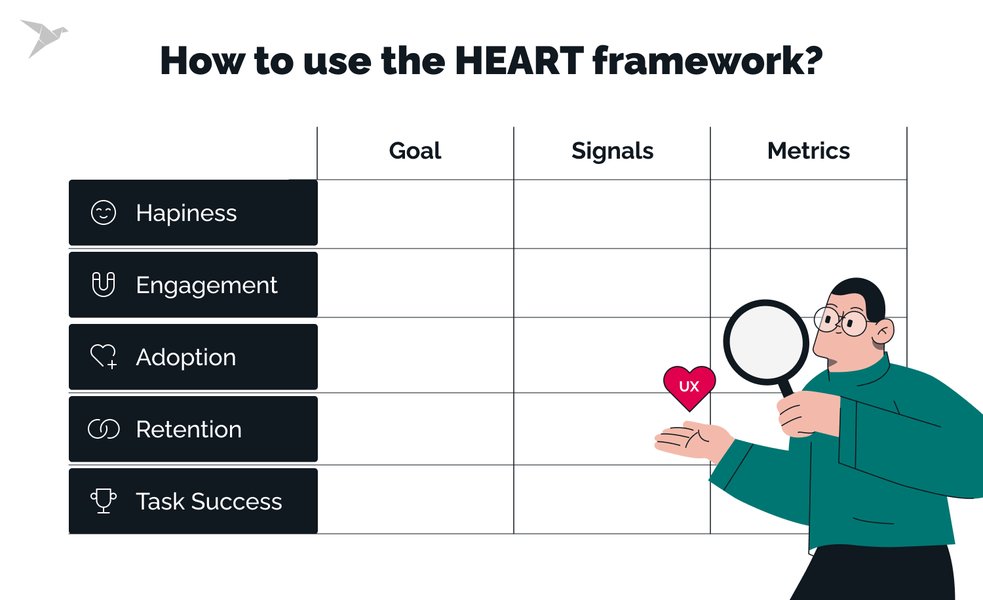
The five pillars of the HEART framework.
The Five Pillars of HEART:
- Happiness: Measures users' subjective feelings and attitudes towards the product. This is often gauged through surveys (like Net Promoter Score - NPS, Customer Satisfaction - CSAT, or System Usability Scale - SUS), ratings, or sentiment analysis.
- Engagement: Tracks the level of user involvement and interaction intensity. Metrics might include frequency of visits, session duration, depth of interaction (e.g., features used per session), or number of active users (daily/monthly).
- Adoption: Measures the rate at which new users start using a product or a specific feature within a given timeframe. Examples include new account creations, feature opt-ins, or downloads.
- Retention: Assesses how many users return to the product over time. Key metrics are churn rate, repeat usage rates (e.g., percentage of users returning after 7 days), or cohort retention analysis.
- Task Success: Evaluates users' ability to complete key tasks efficiently and effectively. This involves measuring task completion rates, time taken to complete a task, error rates, or search success rates.
The Goals-Signals-Metrics (GSM) Process
HEART is often implemented using the Goals-Signals-Metrics (GSM) process. This ensures that the chosen metrics are meaningful and actionable:
- Goals: Define the high-level objectives for a product or feature (e.g., "Increase user satisfaction with the checkout process").
- Signals: Identify lower-level indicators that signify progress towards the goal (e.g., reduced cart abandonment, fewer reported issues, higher satisfaction ratings post-checkout).
- Metrics: Choose specific, trackable metrics to measure the signals (e.g., decrease in cart abandonment rate %, increase in CSAT score for checkout, reduction in error rate during payment).
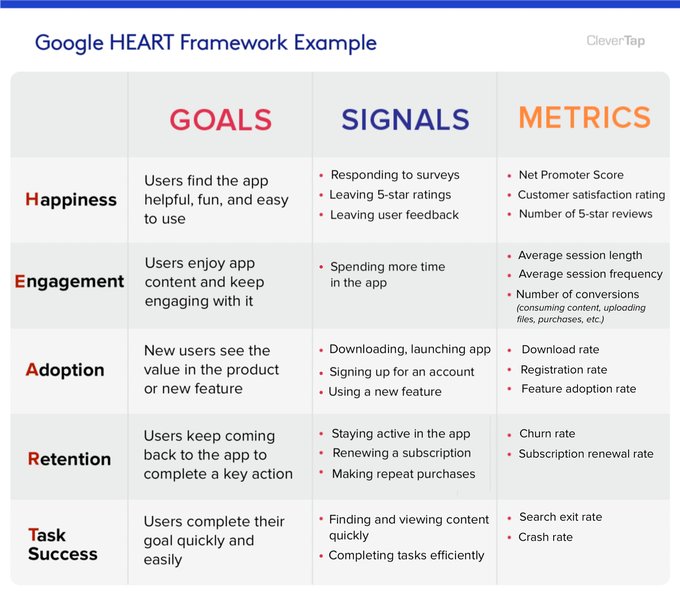
Connecting Goals to Signals and Metrics within the HEART framework.
This methodical approach helps teams focus on metrics that truly reflect user experience quality and contribute to overarching product goals, making HEART a versatile tool for various product stages and types.
Comparing HEART to Other UX Frameworks
While HEART offers a robust, user-centric view, several other frameworks provide different lenses through which to measure UX and product performance. Understanding their distinctions is crucial for selecting the right approach.
HEART vs. AARRR (Pirate Metrics)
Focus and Components:
AARRR, often called "Pirate Metrics," stands for Acquisition, Activation, Retention, Referral, and Revenue. It primarily focuses on the customer lifecycle funnel and business growth metrics.
- Acquisition: How do users find you? (Channels, cost per acquisition)
- Activation: Do users have a great first experience? (Sign-ups completing key action)
- Retention: Do users come back? (Similar to HEART's Retention)
- Referral: Do users tell others? (Viral coefficient, referral program usage)
- Revenue: How do you make money? (Customer lifetime value, conversion rate)
Key Differences:
- Orientation: AARRR is strongly business and marketing-oriented, tracking the conversion funnel. HEART is more product and user-experience oriented, focusing on satisfaction and usability alongside engagement and retention.
- Metrics: HEART includes unique UX-focused metrics like Happiness and Task Success, which are absent in AARRR. AARRR includes Revenue and Referral, which are outside HEART's core scope.
- Use Case: AARRR is often favored by startups and growth teams focused on scaling and monetization. HEART is typically used by product and UX teams aiming to improve the core user experience.
HEART vs. RARRA
RARRA is a variation of AARRR that reorders the priorities: Retention, Activation, Referral, Revenue, Acquisition. By placing Retention first, it emphasizes retaining existing users as the primary driver of sustainable growth. While its focus shifts slightly towards user loyalty compared to AARRR, it remains fundamentally a business growth framework, lacking the deep UX insights (Happiness, Task Success) provided by HEART.
HEART vs. System Usability Scale (SUS)
Focus and Components:
SUS is not a comprehensive framework but a specific, widely used questionnaire designed to measure the perceived usability of a system. It consists of 10 Likert-scale questions, resulting in a single score from 0 to 100.
Key Differences:
- Scope: SUS measures only one aspect of UX – perceived usability. HEART is a multi-dimensional framework covering usability (within Task Success), satisfaction (Happiness), engagement, and lifecycle metrics (Adoption, Retention).
- Nature: SUS provides a standardized, quantitative score based on subjective user feedback. HEART combines qualitative (e.g., survey data for Happiness) and quantitative (e.g., behavioral data for Engagement) metrics.
- Application: SUS is a quick tool for benchmarking usability or comparing designs. HEART provides a continuous, holistic monitoring system for overall UX health. SUS scores can actually be incorporated into HEART's Happiness category.
HEART vs. Customer Experience Index (CX Index)
Focus and Components:
A CX Index typically represents a composite score derived from various customer feedback metrics (like NPS, CSAT, Customer Effort Score - CES) to provide a high-level view of the overall customer experience and loyalty.
Key Differences:
- Granularity: CX Index offers a high-level, aggregated score, useful for benchmarking and executive reporting. HEART provides more granular insights across its five distinct categories, making it more actionable for product teams diagnosing specific UX issues.
- Scope: While both relate to user sentiment, HEART explicitly includes behavioral metrics (Engagement, Adoption, Retention) and effectiveness metrics (Task Success), which are typically not part of a standard CX Index.
- Methodology: HEART uses the GSM process to link metrics to specific goals. CX Index is generally a score calculated from survey results.
HEART vs. Other Approaches (PULSE, CASTLE)
- PULSE: An earlier Google framework (Page views, Uptime, Latency, Seven-day active users, Earnings), PULSE focused more on technical performance and business health metrics rather than the user's direct experience quality, a gap HEART was designed to fill.
- CASTLE: Developed by NN/g, CASTLE is an adaptation of HEART specifically for measuring the UX of workplace/enterprise applications. It shares core ideas but adds dimensions relevant to organizational contexts like Collaboration, Autonomy, Structure, Trust, Leadership, and Efficiency. It's essentially a specialized extension rather than a direct competitor for general product UX.
Visualizing the Frameworks: Mindmap Overview
This mindmap illustrates the core focus and components of the major UX measurement frameworks discussed, highlighting their relationships and distinct characteristics.
Framework Comparison: A Radar Chart Perspective
This radar chart provides a visual comparison of the HEART, AARRR, SUS, and CX Index frameworks across several key dimensions. The scores (ranging notionally from 1 to 5, where 5 is highest) represent a qualitative assessment of each framework's strength in that particular area, based on their typical focus and application.
As the chart illustrates, HEART provides the most balanced and holistic view of user experience, scoring well on user satisfaction, behavioral insights, and task effectiveness. AARRR excels in business growth focus but lacks depth in UX quality metrics. SUS is highly specialized for usability perception and simple to use, while CX Index provides a strong measure of overall satisfaction but less granular detail.
Strengths and Weaknesses: A Comparative Table
This table summarizes the core purpose, strengths, weaknesses, and ideal use cases for each major framework discussed.
| Framework | Primary Purpose | Key Strengths | Key Weaknesses | Ideal Use Case |
|---|---|---|---|---|
| HEART | Measure overall user experience quality holistically. | Balanced (attitudinal + behavioral), user-centric, actionable via GSM, scalable. | Can be complex to set up initially, requires combining different data sources (surveys, analytics). | Product/UX teams improving core experience, ongoing monitoring of UX health. |
| AARRR | Track customer lifecycle funnel for business growth. | Simple, business-focused, aligns well with marketing/sales, tracks conversions effectively. | Lacks focus on UX quality (satisfaction, usability), potentially overlooks user friction points. | Startups, growth teams, e-commerce, marketing campaign tracking. |
| RARRA | Track customer lifecycle with a focus on retention-led growth. | Prioritizes retention, simple, actionable for growth loops. | Similar weaknesses to AARRR regarding lack of deep UX focus. | Subscription businesses, products focused on long-term user value. |
| SUS | Measure perceived system usability quickly. | Standardized, validated, quick to administer, provides a single comparable score. | Very narrow scope (usability only), doesn't explain *why* usability is good/bad, subjective. | Quick usability checks, benchmarking against competitors, comparing design iterations. |
| CX Index | Provide a high-level score for overall customer experience/satisfaction. | Simple score for executive reporting, good for tracking overall sentiment trends, incorporates loyalty. | Lacks granularity, not very diagnostic for specific UX issues, often relies solely on survey data. | Large organizations benchmarking CX, tracking brand perception, service-oriented industries. |
Watch: Understanding Google's HEART Framework
For a visual explanation of how the HEART framework works and how to define UX metrics using it, check out this helpful video:
This video provides a concise overview of the HEART framework's components and its practical application in defining and using UX metrics for product improvement, aligning well with the Goals-Signals-Metrics approach discussed earlier.
Frequently Asked Questions (FAQ)
Can HEART and AARRR be used together?
Is HEART only for large companies like Google?
How is 'Happiness' measured in the HEART framework?
Which framework is best for a mobile app?
Recommended Further Exploration
- How can I implement the HEART framework using the Goals-Signals-Metrics process for my specific product?
- Can you provide specific examples of metrics for each category within the HEART framework?
- In what specific situations would the CASTLE framework be more appropriate than HEART for enterprise applications?
- What are the key differences between quantitative and qualitative UX metrics and how do frameworks like HEART use both?
References
Last updated May 5, 2025