
Unlocking Smart Home Insights: Integrating Hubitat Data with Grafana
Transforming Raw Home Automation Data into Actionable Visualizations
Integrating your Hubitat Elevation smart home hub with Grafana, often in conjunction with InfluxDB, offers a powerful solution for collecting, storing, and visualizing a wealth of data from your smart devices. This synergy allows you to move beyond basic automation by gaining deep insights into your home's performance, environmental conditions, and device behavior over time. From tracking temperature fluctuations to monitoring energy consumption and device activity, Grafana dashboards provide a customizable and dynamic interface to understand your smart home's ecosystem.
Key Highlights of Hubitat-Grafana Integration
- Comprehensive Data Collection: Leverage Hubitat's capabilities, particularly through apps like InfluxDB Logger or Maker API, to efficiently send various sensor and device data to a time-series database like InfluxDB.
- Powerful Visualization with Grafana: Utilize Grafana's robust dashboarding features to create rich, interactive visualizations (graphs, gauges, discrete panels) that transform raw data into understandable trends and metrics.
- Enhanced Smart Home Analytics: Gain deeper insights into historical data, identify patterns, troubleshoot issues, and optimize your smart home automations based on actual performance metrics, moving beyond simple real-time status.
The Ecosystem: Hubitat, InfluxDB, and Grafana
The typical setup for visualizing Hubitat data involves a three-tiered architecture: Hubitat Elevation as the data source, InfluxDB as the time-series database, and Grafana as the visualization platform. This combination creates a robust system for collecting, storing, and presenting your smart home's operational data.
Hubitat Elevation: Your Smart Home Data Source
The Hubitat Elevation hub serves as the central control point for your smart home devices. It connects to a wide array of Zigbee, Z-Wave, and LAN/cloud devices, collecting events and attribute changes from sensors, switches, and other components. While Hubitat provides its own dashboarding capabilities, its strength lies in its local processing and automation. To leverage its data for advanced analytics, external integration is key.
For data logging, the InfluxDB Logger app is a popular choice within the Hubitat community. This app simplifies the process of forwarding events from your Hubitat devices to an external InfluxDB instance. Alternatively, the Maker API can be used to extract metrics, which can then be processed by tools like hubitat2prom to generate Prometheus metrics, suitable for Grafana integration.
InfluxDB: The Time-Series Database
InfluxDB is a purpose-built time-series database optimized for handling large volumes of time-stamped data, making it an ideal choice for smart home sensor readings and event logs. It efficiently stores data points with their corresponding timestamps, allowing for quick retrieval and analysis over periods ranging from minutes to years.
When setting up InfluxDB, you'll create a "bucket" to store your Hubitat data. This bucket acts as a logical container for your time-series measurements. Whether you're using InfluxDB 1.x (with InfluxQL) or 2.x (with Flux query language), ensuring proper configuration is crucial for seamless data flow from Hubitat.
InfluxDB can be installed on various platforms, including Windows, Ubuntu Linux (often on a Raspberry Pi), or within Docker containers on a Synology NAS. Running it in a Docker container alongside Grafana is a common and efficient deployment strategy, as it simplifies environment setup and management.
Grafana: The Visualization Powerhouse
Grafana is an open-source analytics and monitoring solution that enables you to query, visualize, alert on, and understand your metrics no matter where they are stored. Its strength lies in its highly customizable dashboards, which can display data from various sources, including InfluxDB, using a wide array of panel types like graphs, gauges, stat panels, and tables.
Grafana dashboards allow you to create a visual narrative of your smart home. You can track temperature trends over days, visualize energy consumption patterns, monitor device uptime, or even observe the frequency of motion sensor triggers. Grafana's flexibility in query language (Flux or InfluxQL for InfluxDB) and panel options makes it incredibly versatile for any type of smart home data.
Setting Up the Hubitat-InfluxDB-Grafana Stack
Implementing this powerful trio involves several key steps, regardless of your chosen operating system (Windows, Linux, or Docker):
1. Installing InfluxDB and Grafana
The first step is to install InfluxDB and Grafana on your chosen server or device. Many users opt for a dedicated mini-PC, a Raspberry Pi, or a NAS that supports Docker for this purpose. Docker is often recommended for ease of deployment and management.
# Example Docker Compose for InfluxDB and Grafana
version: '3'
services:
  influxdb:
    image: influxdb:latest
    ports:
      - "8086:8086"
    volumes:
      - influxdb_data:/var/lib/influxdb2
    environment:
      - DOCKER_INFLUXDB_INIT_MODE=setup
      - DOCKER_INFLUXDB_INIT_USERNAME=admin
      - DOCKER_INFLUXDB_INIT_PASSWORD=your_password
      - DOCKER_INFLUXDB_INIT_ORG=your_org
      - DOCKER_INFLUXDB_INIT_BUCKET=Hubitat
      - DOCKER_INFLUXDB_INIT_ADMIN_TOKEN=your_token

  grafana:
    image: grafana/grafana:latest
    ports:
      - "3000:3000"
    volumes:
      - grafana_data:/var/lib/grafana
    environment:
      - GF_SECURITY_ADMIN_USER=admin
      - GF_SECURITY_ADMIN_PASSWORD=admin
    depends_on:
      - influxdb
volumes:
  influxdb_data:
  grafana_data:
After installation, you typically access Grafana via your server's IP address on port 3000 (e.g., http://serverip:3000), with default login credentials often being admin/admin, which you should change immediately.
2. Configuring Hubitat to Send Data
Once InfluxDB is ready, you need to configure your Hubitat hub to send data to it. The most common method involves installing the InfluxDB Logger app on your Hubitat Elevation hub. This app allows you to select which devices and attributes you want to log, and then points them to your InfluxDB instance using its IP address and port.
For more advanced users, the Hubitat Maker API combined with a solution like hubitat2prom can expose Hubitat metrics in a Prometheus-compatible format, which Grafana can then directly consume.
3. Connecting Grafana to InfluxDB
Within Grafana, you must set up InfluxDB as a data source. This involves navigating to the "Connections" section (often via the "sandwich icon" in the upper left), adding a new data source, and selecting InfluxDB. You'll need to provide the InfluxDB server address (e.g., http://localhost:8086 if running on the same host), database name (e.g., "Hubitat"), and authentication details.
For InfluxDB 2.x, ensure you select "Flux" as the query language and provide the organization, bucket, and API token. If you're using InfluxDB 1.x, you'll use InfluxQL.
4. Building Your First Dashboard
With the data source configured, you can start building your Grafana dashboards. You can create a new dashboard from scratch or import pre-built Hubitat dashboards shared by the community on Grafana Labs or Hubitat forums. Importing a JSON model of a dashboard is an easy way to get started.
When building panels, you'll write queries (Flux or InfluxQL) to select the data you want to visualize. For instance, to graph temperature data from a sensor, your query might look like this:
// Example Flux query for temperature
from(bucket: "Hubitat")
  |> range(start: v.timeRangeStart, stop: v.timeRangeStop)
  |> filter(fn: (r) => r._measurement == "temperature" and r.deviceId == "your_temp_sensor_id")
  |> aggregateWindow(every: v.windowPeriod, fn: mean, createEmpty: false)
  |> yield(name: "mean_temperature")
Grafana offers various panel types, such as:
- Graph: Ideal for showing trends over time (e.g., temperature, humidity, power consumption).
- Gauge: Useful for displaying current values with thresholds (e.g., current room temperature).
- Stat: Shows a single statistic (e.g., average daily temperature).
- Table: For displaying raw data or aggregated statistics.
Figure 1: Radar chart illustrating the capabilities of the Hubitat-InfluxDB-Grafana stack in smart home data analytics.
This radar chart visually compares the capabilities of a Hubitat-InfluxDB-Grafana setup against a basic Hubitat dashboard. It highlights how the integrated stack excels in data collection efficiency, visualization flexibility, and particularly in historical data analysis, offering a more comprehensive analytical experience for smart home data.
Practical Applications and Best Practices
The insights gained from your Grafana dashboards can be invaluable for optimizing your smart home. Here are some practical applications and best practices:
Monitoring Environmental Conditions
Track temperature, humidity, and illuminance levels across different rooms. This can help you identify areas with poor insulation, optimize HVAC usage, or understand how natural light affects your home throughout the day.
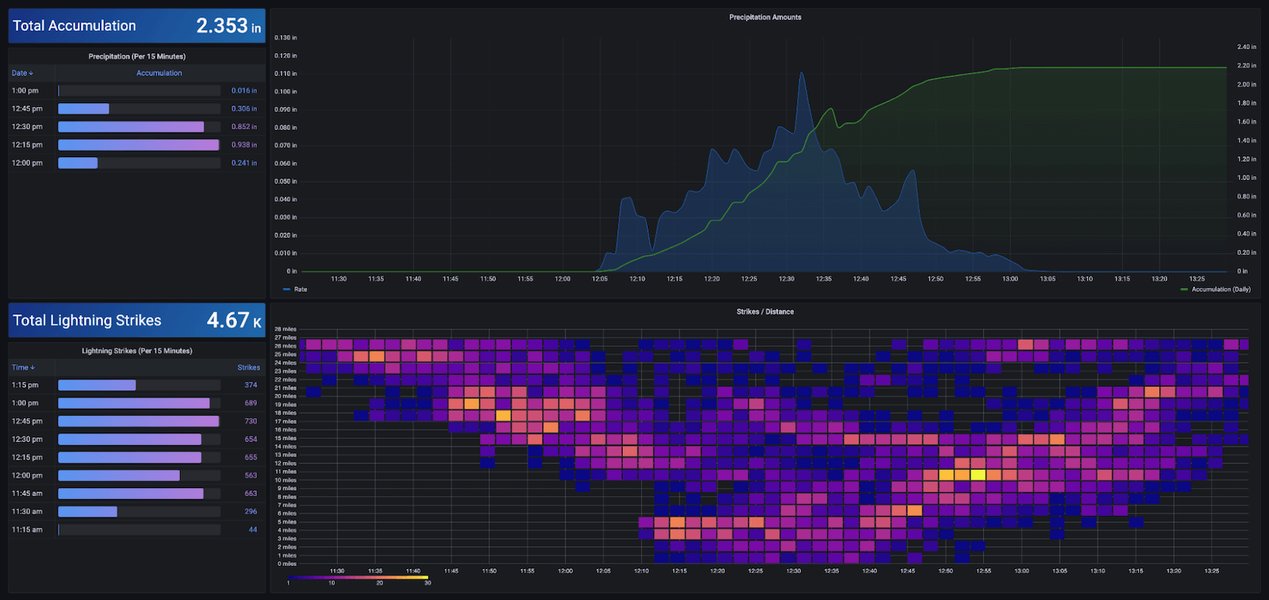
Figure 2: An example Grafana dashboard visualizing real-time weather station data, showcasing the potential for environmental monitoring.
Analyzing Energy Consumption
If you have smart plugs or devices that report power usage, Grafana can graph energy consumption over time, allowing you to identify energy vampires, understand peak usage periods, and make informed decisions to reduce your electricity bill.
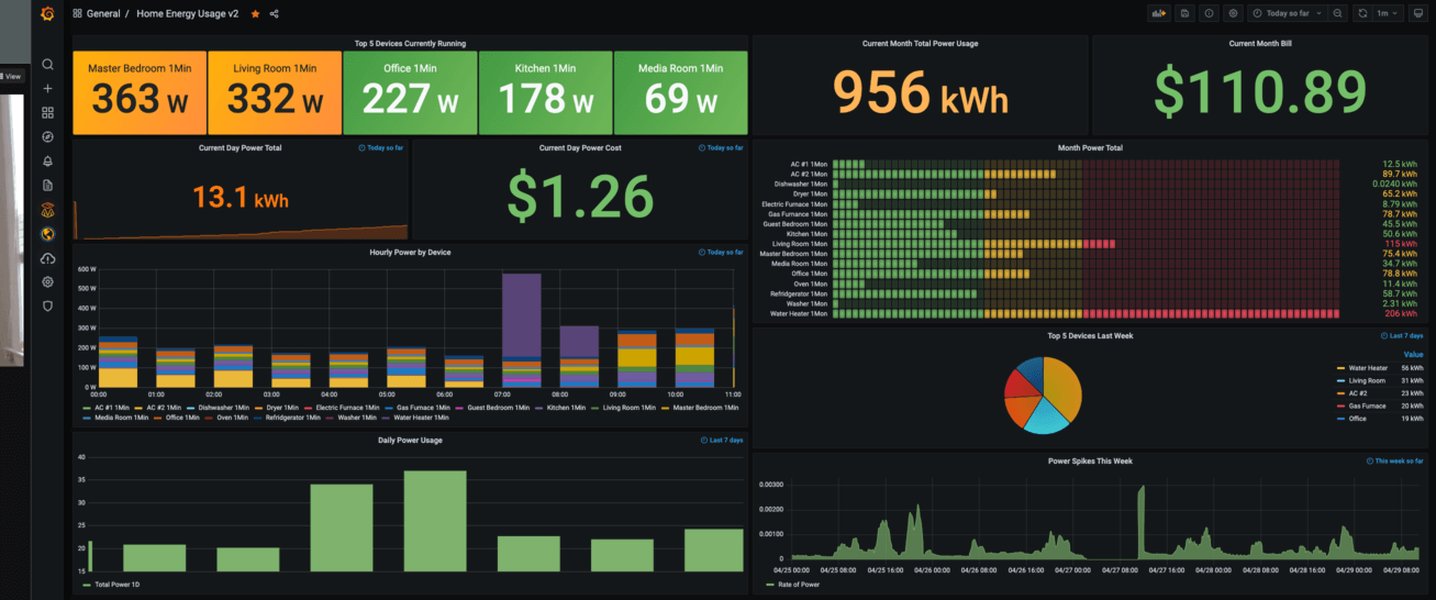
Figure 3: A Grafana dashboard displaying home energy usage, providing insights into consumption patterns.
Device Performance and Health
Monitor battery levels of your Zigbee/Z-Wave devices, track the responsiveness of switches, or observe the frequency of motion sensor activations. This helps in proactive maintenance and ensures your automations are running smoothly.
Customizing Your Dashboards
Grafana offers extensive customization options. Use easy drop-down menus to configure data sources and tailor panels. Experiment with different panel types (gauge, graph, natel-discrete-panel) and adjust time ranges to gain various perspectives on your data. You can also leverage variables and templates for dynamic dashboards that can easily switch between different devices or locations.
Community Resources and Shared Dashboards
The Hubitat and Grafana communities are excellent resources for shared dashboards and best practices. Many users share their JSON configurations for dashboards, which can be easily imported into your Grafana instance, giving you a head start on complex visualizations.
Common Challenges and Solutions
| Challenge | Description | Solution |
|---|---|---|
| Data Source Configuration | Incorrect settings for InfluxDB (e.g., wrong IP, port, token, or bucket name). | Double-check InfluxDB connection details in Grafana. Ensure correct API tokens and organization IDs are used for InfluxDB 2.x. Verify network connectivity between Grafana and InfluxDB. |
| Query Language (Flux vs. InfluxQL) | Difficulty writing queries, especially with InfluxDB 2.x's Flux language. | Refer to InfluxDB documentation for Flux query examples. Utilize Grafana's query builder. Start with simple queries and gradually increase complexity. Import community-shared dashboards for Flux examples. |
| Data Granularity | Data points being too sparse or too dense for effective visualization. | Adjust the aggregateWindow function in Flux or equivalent in InfluxQL to change the time aggregation (e.g., every: 1h for hourly averages, every: 5m for 5-minute averages). |
| Dashboard Layout and Design | Dashboards appearing cluttered or difficult to interpret. | Organize panels logically by device type or room. Use clear titles and units. Leverage Grafana's drag-and-drop interface for intuitive design. Group related metrics together. |
| InfluxDB Version Compatibility | Issues arising from using InfluxDB 1.x data with Grafana setups expecting 2.x or vice versa. | Ensure your Grafana data source is configured for the specific InfluxDB version you are running. InfluxDB 2.x requires Flux, while 1.x uses InfluxQL. If migrating, be aware of DBRP mappings for backward compatibility. |
This table outlines common challenges encountered when integrating Hubitat data with Grafana and provides actionable solutions to overcome them.
Figure 4: This video provides a comprehensive guide on how to install Grafana and set up a dashboard step-by-step. It's highly relevant as it walks users through the initial setup process, which is foundational for visualizing Hubitat data.
Frequently Asked Questions (FAQ)
Conclusion
The integration of Hubitat Elevation with InfluxDB and Grafana creates a powerful, comprehensive system for smart home data analytics. This setup transcends simple real-time monitoring, enabling users to delve into historical trends, optimize automations, and gain unprecedented insights into their living spaces. By transforming raw sensor data into rich, interactive visualizations, you can make more informed decisions about energy consumption, environmental control, and device maintenance, truly enhancing your smart home experience.
Recommended Further Exploration
- Explore detailed setup guides for the InfluxDB Logger app on Hubitat.
- Discover advanced techniques for designing dynamic and interactive Grafana dashboards.
- Learn common troubleshooting steps for connectivity and data flow problems in the stack.
- Dive deeper into writing effective Flux queries for time-series data analysis in Grafana.
References
Last updated May 21, 2025