
Unveiling the Algorithmic Precision: A Deep Dive into the ICT Trading Strategy Blueprint
Discover the core mechanics, step-by-step processes, and institutional insights behind the Inner Circle Trader methodology.
Key Highlights of the ICT Approach
- Emulate Institutional Moves: ICT focuses on understanding and trading alongside "Smart Money" by identifying liquidity grabs, order flow, and areas where large institutions are likely to transact.
- Price Action Purity: The strategy prioritizes raw price movements, market structure analysis (highs, lows, breaks of structure), and specific price patterns over reliance on traditional lagging indicators.
- Precision Timing & Price: Specific trading sessions (e.g., London, New York) and "Kill Zones" are crucial for identifying high-probability setups, as the strategy posits that institutional algorithms operate on specific time and price theories.
Introduction: Decoding the Market's Algorithm
The Inner Circle Trader (ICT) methodology, developed by Michael J. Huddleston, is a comprehensive trading approach that aims to interpret and leverage the perceived algorithmic nature of financial markets. It operates on the premise that institutional traders, often termed "Smart Money," leave discernible footprints in price action. The ICT strategy is designed to identify these footprints, understand market manipulation tactics, and pinpoint high-probability trade setups by focusing on liquidity, market structure, and price inefficiencies. This blueprint outlines the core components and algorithmic thought process behind ICT trading.
Core Concepts: The Building Blocks of ICT
Understanding these fundamental concepts is essential before delving into the step-by-step algorithmic process. They form the lens through which an ICT trader analyzes the market.
Market Structure & Bias
Understanding Directional Intent
Market structure analysis involves identifying the prevailing trend by observing swing highs and lows. A series of higher highs and higher lows indicates an uptrend (bullish bias), while lower lows and lower highs suggest a downtrend (bearish bias). A "Break of Structure" (BOS) or "Market Structure Shift" (MSS) occurs when price decisively breaks a previous swing point, potentially signaling a change in trend or a continuation. Establishing a directional bias on higher timeframes is the foundational first step.
Liquidity: The Market's Fuel
Where Orders Cluster
Liquidity refers to areas on the price chart where a large number of orders are likely to accumulate. This includes:
- Buy-side Liquidity: Resting above old highs, where breakout traders might place buy stops and short sellers place their stop losses.
- Sell-side Liquidity: Resting below old lows, where breakout traders might place sell stops and long traders place their stop losses.
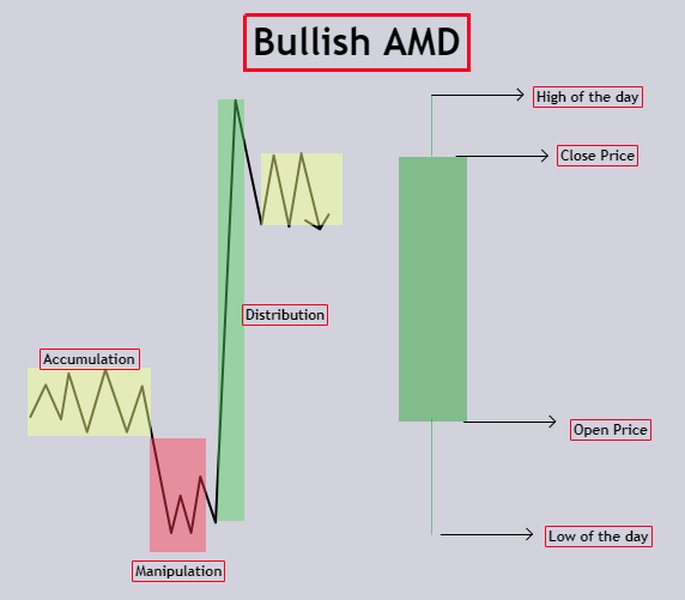
Visualizing the Accumulation, Manipulation, and Distribution (AMD) cycle, a core ICT concept involving liquidity engineering.
Order Blocks (OB)
Institutional Footprints
An Order Block is typically defined as the last up-close candle before a significant down-move (bearish OB) or the last down-close candle before a significant up-move (bullish OB). These areas are believed to represent zones where institutions placed substantial orders. Price often revisits these blocks, offering potential entry points as institutions may defend these levels or use them to add to positions.
Fair Value Gaps (FVG) / Imbalances
Price Inefficiencies
A Fair Value Gap, also known as an imbalance, is a three-candle pattern where there's a visible gap between the wick of the first candle and the wick of the third candle, with the middle candle showing a strong, fast move. This indicates an inefficiency in price delivery. ICT traders expect price to often return to fill these FVGs, providing potential entry or target zones.
Optimal Trade Entry (OTE)
Precision Entry Points
OTE refers to specific Fibonacci retracement levels, typically between 61.8% and 79% (often focusing on the 70.5% level), within a significant price swing that aligns with the established bias. When price retraces into an OTE zone that also coincides with other confluences like an Order Block or FVG, it's considered a high-probability entry area.
Premium & Discount Zones
Assessing Value
Within a defined trading range (e.g., from a significant low to a significant high), ICT divides the range into premium (upper half, good for selling) and discount (lower half, good for buying) zones, with the 50% level being equilibrium. The idea is to buy at a discount and sell at a premium, aligning with how institutions might perceive value.
Displacement
Signs of Strong Intent
Displacement refers to a strong, energetic price move that often breaks market structure and typically leaves behind Fair Value Gaps. Such moves are seen as indicative of significant institutional participation and a clear intention to move price in a particular direction.
Time-Based Elements: Sessions & Kill Zones
The Importance of Timing
ICT places significant emphasis on time. Specific trading sessions, particularly the London Open and New York Open, are considered high-liquidity periods where institutional activity is most pronounced. "Kill Zones" are specific time windows within these sessions (e.g., 2:00 AM - 5:00 AM ET for London Kill Zone) where high-probability setups are expected to form.
The Algorithmic Blueprint: A Step-by-Step Guide
The ICT trading strategy algorithm can be conceptualized as a sequence of analytical steps and decision-making processes. While not a rigid automated system for all, it provides a structured framework.
Step 1: Multi-Timeframe Analysis & Bias Determination
Begin by analyzing higher timeframes (e.g., Monthly, Weekly, Daily) to establish the overarching market bias. Look for clear market structure (higher highs/lows for bullish, lower lows/highs for bearish) and significant Order Blocks or FVGs that could influence long-term price direction.
Step 2: Identifying Key Areas of Interest (PD Arrays)
On intermediate timeframes (e.g., 4-hour, 1-hour), identify "PD Arrays" – Premium and Discount arrays. These are key reference points such as:
- Order Blocks
- Fair Value Gaps
- Liquidity Pools (old highs/lows, equal highs/lows)
- Breaker Blocks / Mitigation Blocks
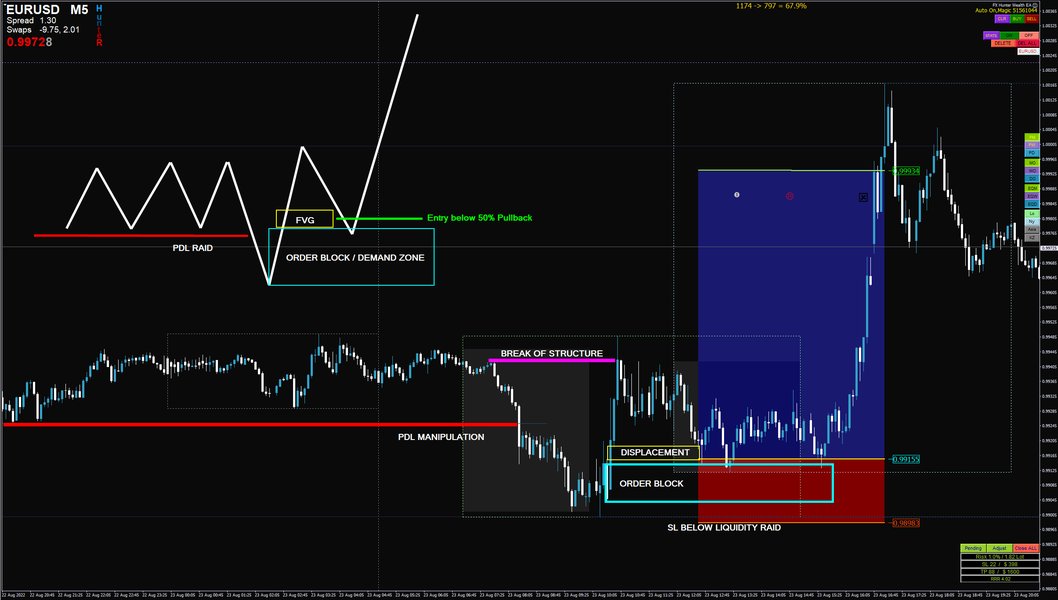
An example of ICT chart markups identifying key levels such as Order Blocks, Fair Value Gaps, and structural points for potential trade setups.
Step 3: Waiting for Liquidity Events & Entry Models
With bias established and key levels marked, wait for price to interact with these zones, often during specific Kill Zones. Look for:
- Liquidity Sweeps: Price raiding liquidity above an old high or below an old low, then showing signs of reversal.
- Retracement to Key Levels: Price pulling back into a pre-identified Order Block, FVG, or OTE level within a premium/discount zone that aligns with the bias.
Step 4: Lower Timeframe Confirmation & Precision Entry
Once price interacts with a higher-timeframe area of interest, drop to lower timeframes (e.g., 15-minute, 5-minute, even 1-minute) to look for confirmation. This often involves:
- A Market Structure Shift (MSS) or Break of Structure (BOS) on the LTF, confirming a change in order flow.
- Price retesting a newly formed LTF Order Block or FVG after the MSS.
- Entry at an OTE within the LTF swing that caused the MSS.
Step 5: Trade Execution and Strategic Risk Management
Once a valid setup with LTF confirmation occurs:
- Entry: Execute the trade based on the chosen entry model.
- Stop Loss: Place the stop loss logically, often beyond the swing point that was violated in a liquidity sweep, or on the other side of the Order Block/FVG that's being traded from. The stop should invalidate the trade idea if hit.
- Position Sizing: Calculate position size based on a predetermined risk percentage per trade (e.g., 1-2% of capital).
Step 6: Trade Management & Target Acquisition
Trade targets are typically set at:
- Opposing liquidity pools.
- Significant FVGs on higher timeframes.
- Structurally significant swing points.
Step 7: Continuous Learning & Psychological Discipline
The ICT methodology is not a static system. It requires ongoing study, practice, and adaptation to evolving market conditions. Reviewing trades (both wins and losses), maintaining detailed journals, and mastering trading psychology are crucial for long-term success. Discipline in adhering to the plan and managing emotions is essential.
Conceptual Pseudocode for ICT Logic
While not a direct script, the following pseudocode (inspired by Answer D) illustrates the general decision flow:
// Pseudocode for a conceptual ICT Algorithm
function ictTradeDecisionProcess():
    // Step 1: Establish Higher Timeframe (HTF) Bias
    HTF_bias = analyzeMarketStructure(monthly_chart, weekly_chart, daily_chart) // e.g., bullish, bearish, or neutral

    // Step 2: Identify Key PD Arrays on Intermediate Timeframe (ITF)
    key_levels_ITF = findPDArrays(HTF_bias, H4_chart, H1_chart) // (Order Blocks, FVGs, Liquidity Pools)

    // Step 3: Monitor for Entry Conditions during Specific Time Windows (Kill Zones)
    if isKillZoneActive() and price_approaches(key_levels_ITF.relevant_zone):

        // Step 4: Look for Lower Timeframe (LTF) Confirmation
        ltf_confirmation_signal = checkForLTFConfirmation(M15_chart, M5_chart) // (e.g., MSS, FVG entry, OTE)

        if ltf_confirmation_signal.isValid:
            // Step 5: Execute Trade with Risk Management
            entry_price = ltf_confirmation_signal.entry_point
            stop_loss_price = calculateStopLoss(ltf_confirmation_signal.invalidation_level)
            position_size = calculatePositionSize(account_balance, risk_per_trade_pct, stop_loss_price)

            executeTrade(trade_direction = HTF_bias, entry = entry_price, stop_loss = stop_loss_price, size = position_size)

            // Step 6: Set Targets and Manage Trade
            take_profit_levels = identifyProfitTargets(HTF_bias, key_levels_ITF.opposing_liquidity)
            manageOpenTrade(take_profit_levels, stop_loss_price)
        else:
            // No valid LTF confirmation, wait for next opportunity
            continueMonitoring()
    else:
        // Conditions not met (e.g., outside Kill Zone, no interaction with key levels)
        continueMonitoring()

// Note: This is a highly simplified representation. Each function (analyzeMarketStructure, findPDArrays, etc.)
// would involve complex logic based on ICT principles.
Visualizing ICT Concepts: Interconnectedness and Importance
The various elements of the ICT strategy are deeply interconnected. The mindmap below illustrates how these core concepts and procedural steps fit together to form the overall trading blueprint.
To further illustrate the perceived importance and the challenge involved in mastering different facets of ICT, the following radar chart provides a conceptual overview. "Strategic Importance" refers to how critical the element is for successful application of the strategy, while "Difficulty to Master" reflects the typical learning curve associated with it.
Key ICT Terminologies Summarized
The ICT methodology comes with its own distinct vocabulary. Understanding these terms is crucial for interpreting charts and educational materials. The table below provides a quick reference to some of the most common concepts and their significance within the trading algorithm.
| Concept | Description | Role in Algorithm / Strategy | Typical Chart Signature |
|---|---|---|---|
| Market Structure Shift (MSS) / Break of Structure (BOS) | A clear move where price breaks and closes beyond a recent significant swing high (in an uptrend context for shorts) or swing low (in a downtrend context for longs). | Confirms a potential change in short-term order flow, often a prerequisite for an entry signal on lower timeframes. | Price decisively closing beyond a prior swing point, often with momentum. |
| Liquidity Pool | Areas on the chart where a concentration of stop-loss orders and pending entry orders is likely to exist. | These are often targeted by "Smart Money" to fuel their moves (liquidity grab/sweep) or become targets for profit-taking. | Above old swing highs (buy-side liquidity) or below old swing lows (sell-side liquidity); also includes equal highs/lows. |
| Order Block (OB) | The last down-close candle before a strong bullish move, or the last up-close candle before a strong bearish move. Variations include Bullish OB and Bearish OB. | Considered zones where large institutional orders were placed. Price often returns to these levels, offering potential high-probability entry points or strong support/resistance. | A distinct candle (often with a relatively small body and wicks) that precedes a significant, impulsive price move in the opposite direction. |
| Fair Value Gap (FVG) / Imbalance | A three-candle formation where there's a gap between the high of the first candle and the low of the third candle (for a bullish FVG, inverse for bearish), indicating an inefficiency in price delivery. | Acts as a magnet for price; the market often tends to revisit these gaps to "rebalance" price. Used for entries, re-entries, or as profit targets. | A visible gap between the wicks of the first and third candles in a three-candle sequence, with the middle candle showing a strong move. |
| Optimal Trade Entry (OTE) | Specific Fibonacci retracement levels (typically 61.8%, 70.5%, 79%) measured on a significant price swing that aligns with the established directional bias. | Provides precise, high-probability entry points when price retraces into this zone, especially if it coincides with other confluences like an OB or FVG. | Price retracing to the key Fibonacci levels (often marked with a Fib tool) after an impulsive move. |
| Premium / Discount Zones | A trading range (from a significant low to high, or vice-versa) is divided by its 50% equilibrium level. Prices above 50% are in a premium (good for selling), and below 50% are in a discount (good for buying). | Guides the trader to seek buy setups only in discount zones and sell setups only in premium zones, aligning with institutional value perception. | Identified by drawing a Fibonacci retracement tool over a relevant price range; the area above 0.5 is premium, below is discount. |
| Displacement | A strong, energetic, and often one-sided price move that typically breaks market structure and leaves behind Fair Value Gaps. | Signals strong institutional participation and clear directional intent. Often initiates a new leg of a trend or a significant reversal. | A series of large-bodied candles moving rapidly in one direction, often creating gaps (FVGs) in their wake. |
Further Insights: ICT Trading Plan Video Overview
To see how these concepts can be woven into a practical trading plan, the following video offers a perspective on applying ICT principles. It discusses constructing a trading plan, which can be beneficial for understanding how the blueprint components translate to daily trading activities.
This video, titled "EASIEST Way to Trade ICT (Full ICT Trading Plan)," provides a simplified approach to understanding and implementing ICT concepts, which can be helpful for traders looking to create their own structured plan based on this methodology.
Frequently Asked Questions (FAQ)
Recommended Further Exploration
To deepen your understanding of the ICT trading strategy, consider exploring these related queries:
- How to identify high-probability Order Blocks in ICT trading strategy?
- What are the specific timings and characteristics of ICT Kill Zones in Forex and Indices markets?
- Can you explain the concept of Liquidity Sweeps and Stop Hunts in ICT with chart examples?
- How does multi-timeframe analysis integrate with ICT concepts like Fair Value Gaps and Optimal Trade Entry?
References

Last updated May 6, 2025