
Unlocking Market Moves: Your Definitive ICT Trading Strategy Blueprint
A step-by-step guide to understanding and applying the Inner Circle Trader methodology for buy and sell decisions.
The Inner Circle Trader (ICT) methodology, developed by Michael J. Huddleston, offers a unique perspective on navigating the financial markets. It's not just about patterns; it's about understanding the 'why' behind price movements, focusing on institutional behavior, liquidity, and market structure. This blueprint provides a comprehensive checklist and algorithmic approach to help you identify potential buy and sell opportunities in line with ICT principles.
Essential Insights: Key Takeaways from the ICT Approach
- Focus on "Smart Money": ICT strategies aim to align trades with the actions of large institutional players, identifying their footprints in market structure and order flow.
- Liquidity is King: Understanding where liquidity rests (above old highs, below old lows) and how "smart money" targets these zones is fundamental to anticipating market direction.
- Structure Dictates Opportunity: Recognizing shifts in market structure on various timeframes provides crucial confirmation signals for potential entries and trend changes.
The ICT Algorithmic Blueprint: A Step-by-Step Checklist
The ICT methodology can be distilled into a systematic process, an "algorithm" of checks and confirmations, to guide trading decisions. This blueprint breaks down the essential stages and criteria for identifying high-probability setups.
Phase 1: Pre-Trade Analysis & Context Setting
Before even considering a trade, a thorough understanding of the broader market context is crucial. This phase focuses on establishing a directional bias and identifying key areas of interest.
1. Higher Timeframe (HTF) Analysis & Daily Bias Establishment
- Determine Overall Trend: Analyze monthly, weekly, and daily charts to understand the prevailing market direction. Are we in an uptrend (higher highs and higher lows) or a downtrend (lower highs and lower lows)?
- Identify HTF Points of Interest (POIs): Locate significant levels on these higher timeframes. These can include:
- Old Highs and Lows: Key areas where liquidity pools.
- Order Blocks (OBs): Significant bullish or bearish candles that led to a strong move, indicating institutional interest.
- Fair Value Gaps (FVGs) / Imbalances: Price ranges where one side of the market was offered more aggressively than the other, creating an imbalance.
- Breaker Blocks (BBs): Failed order blocks that have been violated and retested.
- Define Daily Bias: Based on the HTF analysis, form a directional bias for the current trading day or week (e.g., bullish, bearish, or neutral/ranging). Is price trading at a premium (good for selling) or a discount (good for buying) relative to a recent price swing?
2. Session Analysis & Time-Based Considerations
- Key Trading Sessions: Be aware of the characteristics of different trading sessions (Asia, London, New York). ICT often emphasizes specific "Killzones" – periods of expected volatility and manipulation, typically around session opens.
- Time and Price Theory: Certain times of day are more prone to institutional activity and liquidity grabs. For instance, the London Open and New York Open are critical periods.
3. Identifying the "Draw on Liquidity"
- Locate Liquidity Pools: Determine where significant buy-side liquidity (above recent highs, resistance levels) and sell-side liquidity (below recent lows, support levels) are resting. The market is often drawn to these areas.
- Anticipate Liquidity Sweeps: Understand that "smart money" may engineer moves to "sweep" or "grab" this liquidity, triggering stop orders and creating volume before initiating a larger move in the intended direction.
Phase 2: Entry Confirmation & Execution Criteria
Once the broader context is established, the focus shifts to lower timeframes (e.g., 4-hour, 1-hour, 15-minute) to look for specific entry confirmations.
4. The Liquidity Event: Purge or Inducement
- Observation of a Liquidity Grab: For a potential buy setup, look for price to sweep sell-side liquidity (e.g., run below an old low). For a potential sell setup, look for price to sweep buy-side liquidity (e.g., run above an old high). This is often a manipulative move to engineer liquidity.
- Inducement: Price might create a small, apparent high or low (inducement) to entice retail traders before moving to take out the actual liquidity and then reversing.
5. Market Structure Shift (MSS) / Break of Structure (BoS)
- Confirmation of Intent: After a liquidity event, look for a clear Market Structure Shift (MSS) or Break of Structure (BoS) on a lower timeframe.
- Bullish MSS/BoS: In a downtrend, after sweeping sell-side liquidity, price breaks above a recent significant swing high with conviction (displacement).
- Bearish MSS/BoS: In an uptrend, after sweeping buy-side liquidity, price breaks below a recent significant swing low with conviction (displacement).
- Displacement: The break of structure should ideally be accompanied by strong, energetic price movement, often leaving behind a Fair Value Gap (FVG), indicating institutional participation.
6. Price Return to a Point of Interest (POI)
- Identifying the Entry Zone: After the MSS/BoS, wait for price to retrace back into a newly formed or respected POI within the leg that caused the MSS/BoS. Common POIs for entry include:
- Fair Value Gaps (FVGs): Price often revisits these imbalances to rebalance before continuing the new trend.
- Order Blocks (OBs): The last up-close candle before a down-move (for sells) or the last down-close candle before an up-move (for buys) that is associated with the MSS/BoS.
- Breaker Blocks (BBs): A previous order block that failed and was broken through with displacement, now acting as support (for buys) or resistance (for sells).
- Premium/Discount Context: For buy setups, the POI should ideally be in a discount zone of the new bullish leg (e.g., below 50% equilibrium). For sell setups, the POI should be in a premium zone of the new bearish leg (e.g., above 50% equilibrium).
7. Optimal Trade Entry (OTE) Refinement (Optional)
- Fibonacci Confluence: The Optimal Trade Entry (OTE) concept uses Fibonacci retracement levels (typically 0.62, 0.705, and 0.79) drawn on the price leg that created the MSS/BoS. An entry within this zone, coinciding with another POI (like an FVG or OB), can offer a high-precision entry.
8. Entry Trigger & Confirmation
- Lower Timeframe Price Action: Look for specific candlestick patterns or price action on a very low timeframe (e.g., 1-minute, 5-minute) as price interacts with your chosen POI, confirming rejection or acceptance of the level.
- No Blind Entries: Do not enter simply because price has touched a level. Wait for confirming price action that aligns with your anticipated direction.
Phase 3: Trade Management & Risk Control
Executing the trade is only part of the process. Proper management is key to long-term success.
9. Stop Loss Placement
- Logical Invalidation: Place your stop loss at a level where your trade idea would be clearly invalidated.
- For Buys: Typically below the swing low that created the MSS, or below the low of the POI being used for entry.
- For Sells: Typically above the swing high that created the MSS, or above the high of the POI being used for entry.
- Avoid Obvious Levels: Be mindful of placing stops too close to obvious support/resistance, as these can be targeted.
10. Take Profit Targets
- Target Next Liquidity Pool: Primary targets are often the next significant opposing liquidity pool (e.g., an old high for buys, an old low for sells).
- HTF POIs: Higher timeframe POIs can also serve as longer-term targets.
- Risk-to-Reward Ratio: Always aim for a favorable risk-to-reward ratio (e.g., 1:2, 1:3, or higher). If the potential reward doesn't justify the risk, reconsider the trade.
11. Continuous Monitoring & Adaptation
- Review and Adjust: Market conditions change. Continuously review your trades and adapt your understanding. Keep a trading journal.
Visualizing ICT Concepts: Importance and Relationships
To better understand the interplay of various ICT elements, the following chart provides a subjective assessment of their importance and frequency in typical ICT trade setups. This helps illustrate which components often play a more critical role or are more frequently observed in high-probability scenarios.
Radar chart illustrating the perceived importance and application frequency of key ICT concepts.
ICT Decision-Making Flow
The following mindmap outlines the general decision-making process involved in an ICT trade setup, from initial analysis to execution. It highlights the sequential nature of checks and confirmations.
Mindmap visualizing the structured approach to ICT trade identification and execution.
ICT Buy vs. Sell Signal Checklist Summary
This table provides a concise comparison of the conditions that typically need to be met for a buy versus a sell signal within the ICT framework. It acts as a quick reference for the core elements of the decision-making process.
| Feature | Buy Setup Condition | Sell Setup Condition |
|---|---|---|
| Overall Bias (HTF) | Bullish market structure; Price in discount array. | Bearish market structure; Price in premium array. |
| Targeted Liquidity | Anticipating a move towards Buy-Side Liquidity (BSL) above. | Anticipating a move towards Sell-Side Liquidity (SSL) below. |
| Initiating Liquidity Event | Sweep of Sell-Side Liquidity (SSL) or key inducement below current price. | Sweep of Buy-Side Liquidity (BSL) or key inducement above current price. |
| Market Structure Shift (MSS/BoS) | Bullish MSS/BoS on a lower timeframe after the liquidity event, confirmed with displacement. | Bearish MSS/BoS on a lower timeframe after the liquidity event, confirmed with displacement. |
| Point of Interest (POI) for Entry | Price retraces to a bullish POI (e.g., Bullish Order Block, Fair Value Gap, Bullish Breaker Block) formed during/after the MSS. | Price retraces to a bearish POI (e.g., Bearish Order Block, Fair Value Gap, Bearish Breaker Block) formed during/after the MSS. |
| POI Zone Context | POI located within a discount range of the new bullish leg. | POI located within a premium range of the new bearish leg. |
| Entry Trigger Confirmation | Price action at the POI confirms bullish intent (e.g., rejection of lower prices, engulfing candle). | Price action at the POI confirms bearish intent (e.g., rejection of higher prices, engulfing candle). |
| Stop Loss Placement | Below the swing low that caused the MSS, or logically below the POI. | Above the swing high that caused the MSS, or logically above the POI. |
| Primary Take Profit Target | Next significant area of Buy-Side Liquidity or a HTF bearish POI. | Next significant area of Sell-Side Liquidity or a HTF bullish POI. |
Comparative checklist for ICT buy and sell setups.
Visualizing an ICT Checklist in Action
Trading platforms and charting tools often allow traders to create or use indicators that help visualize checklist components directly on their charts. The image below is an example of what a user interface might look like when applying an ICT-based checklist or related indicators. Such tools can aid in systematically verifying if the necessary conditions for a trade setup are met, reinforcing discipline in the trading process.
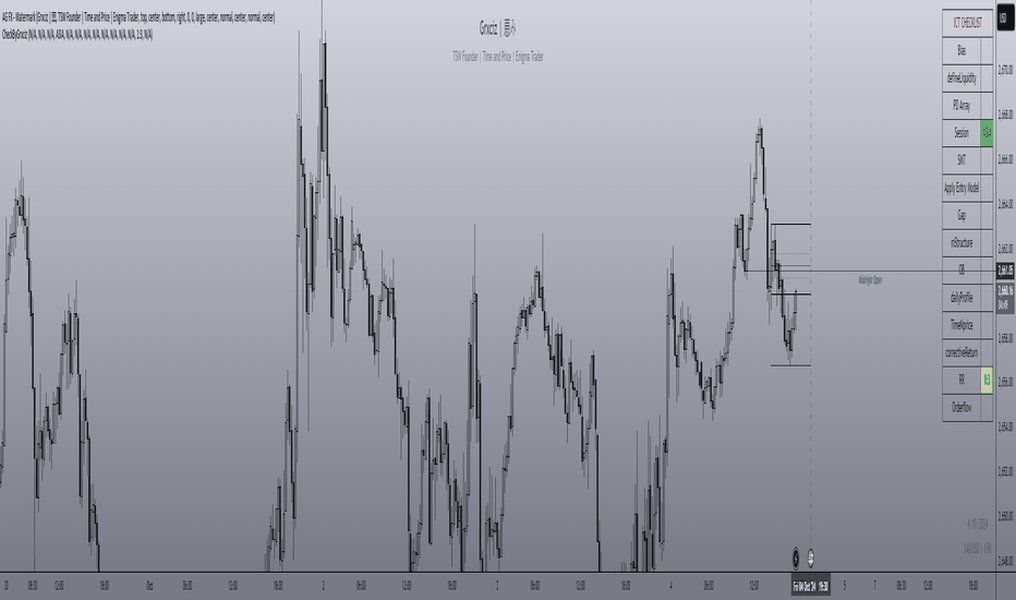
An example of a TradingView script interface for an ICT Checklist, aiding traders in systematically applying ICT criteria.
Deep Dive: ICT 2022 Model Checklist Explained
For traders looking to understand how these concepts come together in a practical model, many ICT educators provide detailed explanations of their trading models, often including checklists. The video below offers insights into how the ICT 2022 Model can be applied, breaking down the components of a trading checklist based on its principles. It emphasizes the importance of a systematic approach, daily bias, liquidity draws, and specific entry patterns. Understanding such models can provide a clearer framework for applying the broader ICT concepts discussed.
A video explaining a full trading checklist based on the ICT 2022 Model.
Frequently Asked Questions (FAQ)
What is the core principle of ICT trading?
The core principle of ICT trading revolves around the idea that financial markets are largely driven by "smart money" – large institutions and market makers. ICT aims to identify the manipulative actions of these entities, such as liquidity grabs and stop hunts, and then trade in alignment with their intended directional moves. It focuses on concepts like market structure, liquidity, order blocks, and fair value gaps to decode institutional footprints.
How important is Higher Timeframe (HTF) analysis in ICT?
Higher Timeframe (HTF) analysis is foundational in ICT. It helps establish the overall market narrative, directional bias (e.g., daily bias), and identifies significant areas where price is likely to be drawn (draw on liquidity) or react (HTF Points of Interest). Trades taken on lower timeframes are typically expected to align with this broader HTF perspective for higher probability.
What are the main types of Points of Interest (POIs) in ICT?
Key Points of Interest (POIs) in ICT where traders look for reactions and potential entries include:
- Order Blocks (OBs): Specific candles indicating institutional buying or selling pressure.
- Fair Value Gaps (FVGs) / Imbalances: Price ranges where there's a clear imbalance between buying and selling, often revisited by price.
- Breaker Blocks (BBs): Order blocks that failed to hold price and were subsequently broken through with force, then often retested.
- Liquidity Voids: Large, quick price moves that leave behind a "void," which price may later fill.
- Old Highs and Lows: Levels where liquidity is pooled.
Is ICT suitable for all types of traders?
ICT concepts can be applied to various trading styles (day trading, swing trading) and markets (forex, indices, crypto). However, it requires significant study, practice, and discipline. The concepts can be complex, and mastering them takes time and effort. It may not be suitable for traders looking for very simple, indicator-based strategies without understanding market mechanics. Patience and a commitment to learning are essential.
What is a "Market Structure Shift" (MSS) in ICT?
A Market Structure Shift (MSS), also often referred to as a Break of Structure (BoS), is a key confirmation signal in ICT. After a liquidity event (like a stop hunt), an MSS occurs when price breaks a recent significant swing point against the previous short-term trend with displacement (a strong, energetic move). For example, in a short-term downtrend, if price sweeps sell-side liquidity and then breaks forcefully above a recent lower high, this is a bullish MSS, signaling a potential change in order flow and a possible start of an uptrend or corrective rally.
Recommended Further Exploration
- How to effectively identify and use Order Blocks in ICT trading?
- What are the differences between various ICT liquidity concepts like inducement and sweeps?
- Can you explain the practical application of Fair Value Gaps in ICT entry strategies?
- How does time of day and market sessions influence ICT trading setups?
References
Last updated May 6, 2025