
Unlocking Process Stability: The Definitive Guide to I/MR Chart Control Limits and the ISO 7870-2 Standard
Discover the preferred method for calculating I/MR control limits, spotlighting the 2.66 * Moving Range Average approach.
Highlights
- Understanding I/MR Charts: These charts are crucial for monitoring processes where data is collected as individual observations, offering insights into both process average and variability.
- The ISO 7870-2 Standard: This international standard provides the framework for Shewhart control charts, including the specific methodology for calculating control limits on I/MR charts.
- The 2.66 Factor Demystified: The constant 2.66, used in calculating control limits for the Individuals (I) chart, is derived from statistical principles (specifically \(3/d_2\)) to establish ±3 standard deviation limits based on the average moving range.
Executive Summary
Statistical Process Control (SPC) provides essential methodologies for monitoring, controlling, and enhancing process stability and quality. Central to SPC are control charts, with the Individuals and Moving Range (I/MR) chart being particularly vital for processes where data points are collected individually rather than in subgroups. The I/MR chart comprises two parts: the Individuals (I) chart, which tracks the process mean, and the Moving Range (MR) chart, which assesses process variability.
The calculation of accurate control limits is paramount for the effective use of I/MR charts. The internationally recognized standard ISO 7870-2:2023 ("Control charts — Part 2: Shewhart control charts") specifies the preferred methods. A key aspect of this standard for I/MR charts is the "2.66 * Moving Range Average" method for determining the control limits on the Individuals (I) chart. This method utilizes the average moving range (\(\overline{MR}\)) as a robust estimator of process variation. The factor 2.66 is derived from \(3/d_2\), where \(d_2\) is a control chart constant (approximately 1.128 for moving ranges based on two consecutive points), effectively setting control limits at approximately three standard deviations from the process average. This report delves into the fundamentals of SPC and control charts, provides a detailed explanation of I/MR charts, and meticulously outlines the calculation of their control limits, with a special emphasis on the ISO 7870-2 defined 2.66 * \(\overline{MR}\) method.
Understanding the Foundations: SPC and Control Charts
What is Statistical Process Control (SPC)?
Statistical Process Control (SPC) is a powerful, data-driven methodology employed in quality management and various industrial processes. Its primary aim is to monitor, control, and ultimately improve processes by utilizing statistical techniques. SPC helps in understanding process behavior and making informed decisions to enhance product quality and operational efficiency. A key aspect of SPC is differentiating between two types of process variation:
- Common Cause Variation: This refers to the natural, inherent, or random fluctuations within a process. It is a stable and predictable pattern of variation that is always present.
- Special Cause Variation: Also known as assignable cause variation, this type arises from unusual, non-routine events or specific identifiable factors that are not part of the normal process. Detecting and eliminating special causes is crucial for process stability.
By focusing on variation, SPC enables organizations to achieve more consistent outputs, reduce defects, and optimize performance.
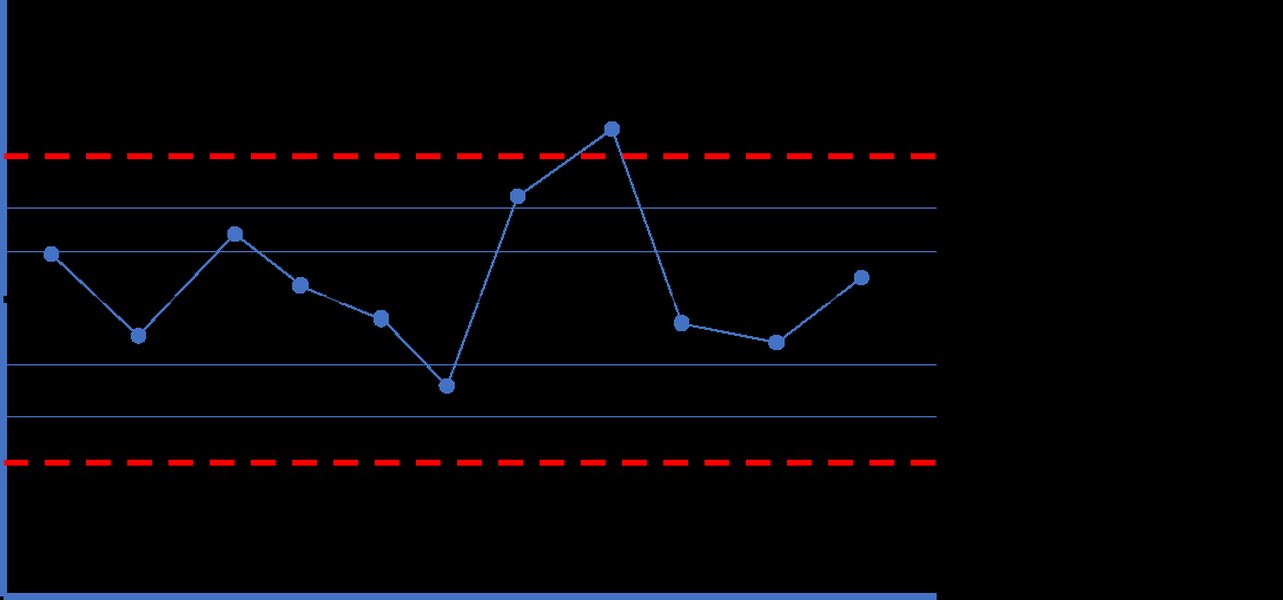
A typical control chart illustrating data points plotted over time with a center line and upper/lower control limits.
The Role of Control Charts
Control charts, originally developed by Dr. Walter A. Shewhart in the 1920s, are the cornerstone tools of SPC. They are essentially time-series graphs that plot process data in chronological order, allowing for the visual tracking of process performance over time. The distinctive feature of a control chart lies in its statistically derived limits. Key components include:
- Center Line (CL): Represents the average or median of the process data, indicating the central tendency of the process.
- Upper Control Limit (UCL): The upper threshold calculated from process data. Data points falling above this limit suggest a potential out-of-control condition due to special cause variation.
- Lower Control Limit (LCL): The lower threshold calculated from process data. Data points below this limit also indicate potential special cause variation.
Control charts serve several critical functions:
- Monitoring Process Stability: They help determine if a process is stable and predictable (in statistical control) or unstable (out of statistical control).
- Detecting Variation: They distinguish between common cause and special cause variation, guiding appropriate actions.
- Facilitating Process Improvement: By identifying out-of-control signals, they pinpoint areas where investigation and corrective action are needed.
- Providing a Basis for Prediction: A stable process allows for prediction of future performance.
Zooming In: The I/MR Chart Explained
What is an I/MR Chart?
The Individuals and Moving Range (I/MR) chart, sometimes referred to as an XmR chart, is a type of Shewhart control chart specifically designed for continuous data where observations are collected individually (i.e., subgroup size n=1). This is in contrast to other charts like X-bar and R charts, which require data to be collected in rational subgroups.
Components of the I/MR Chart
An I/MR chart consists of two distinct but related charts plotted together:
- The Individuals (I) Chart: This chart plots each individual measurement sequentially over time. It is used to monitor the process mean or level and helps detect shifts or trends in the average performance of the process.
- The Moving Range (MR) Chart: This chart plots the moving ranges between consecutive individual observations. The moving range is typically calculated as the absolute difference between two successive data points (\(MR_i = |X_i - X_{i-1}|\)). The MR chart monitors the short-term variability or consistency of the process.
Together, these two charts provide a comprehensive assessment of process stability, looking at both its central tendency and its spread.
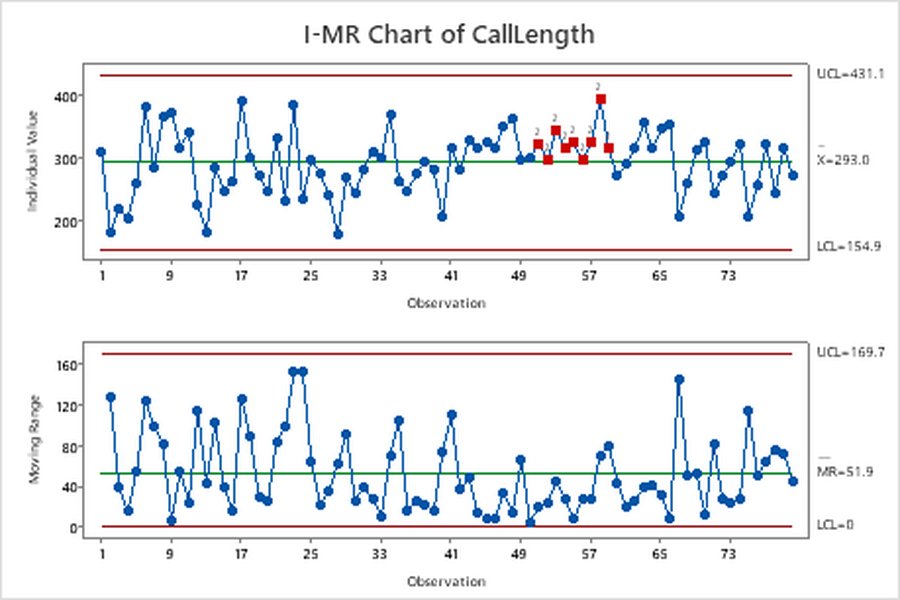
An example of an I/MR chart, illustrating the Individuals (I) chart on top and the Moving Range (MR) chart below.
When to Use an I/MR Chart
I/MR charts are particularly useful in situations such as:
- When measurements are expensive, time-consuming, or destructive.
- In low-volume production environments where collecting subgroups is not feasible.
- For processes with long cycle times between outputs.
- When it's impractical or impossible to form rational subgroups (e.g., tracking a single chemical batch property over time).
- Automated testing where every unit is measured.
The Importance of the MR Chart
It is crucial to examine the Moving Range (MR) chart before interpreting the Individuals (I) chart. The control limits on the I chart are calculated using the average moving range (\(\overline{MR}\)), which estimates process variability. If the MR chart indicates that the process variability is out of control (unstable), then the \(\overline{MR}\) value is unreliable, and consequently, the control limits calculated for the I chart will not be meaningful or accurate. An unstable MR chart suggests that the process spread is unpredictable, and addressing this variability should be the priority.
Calculating Control Limits for I/MR Charts: The Preferred Method
The Guiding Standard: ISO 7870-2:2023
The International Standard ISO 7870-2:2023, "Control charts — Part 2: Shewhart control charts," provides a comprehensive guide to the use and understanding of the Shewhart control chart approach for statistical process control. This standard technically revises and replaces its 2013 predecessor, offering updated guidance and examples. It specifically outlines the methodologies for constructing various Shewhart charts, including I/MR charts, and defines the calculation of their control limits. The methods described are fundamental for ensuring consistency and statistical validity in process monitoring.
Step 1: Calculating Moving Ranges (MR)
The first step in constructing an I/MR chart is to calculate the moving ranges from the sequence of individual observations. For a series of individual measurements \(X_1, X_2, ..., X_n\), the moving range \(MR_i\) between two consecutive points is the absolute difference:
\[ MR_i = |X_i - X_{i-1}| \]This calculation is done for all pairs of consecutive data points, resulting in \(n-1\) moving range values. A moving range typically uses two consecutive data points (span of 2).
Step 2: Calculating Control Limits for the Moving Range (MR) Chart
Once the individual moving ranges are calculated, the next step is to determine the control limits for the MR chart.
Center Line for MR Chart (CLMR)
The center line for the MR chart is the average of all calculated moving ranges, denoted as \(\overline{MR}\):
\[ \overline{MR} = \frac{\sum_{i=2}^{n} MR_i}{n-1} \]Control Limits for MR Chart (UCLMR and LCLMR)
The control limits for the MR chart are calculated using \(\overline{MR}\) and standard control chart constants \(D_3\) and \(D_4\), which depend on the number of observations used to calculate each range (which is 2 for standard I/MR moving ranges):
\[ UCL_{MR} = D_4 \times \overline{MR} \] \[ LCL_{MR} = D_3 \times \overline{MR} \]For a moving range based on 2 observations (the most common case):
- \(D_4 \approx 3.267\) (or sometimes cited as 3.268)
- \(D_3 = 0\) (meaning the LCLMR is effectively zero, as ranges cannot be negative)
Step 3: Calculating Control Limits for the Individuals (I) Chart
After establishing that the process variability is in control (based on the MR chart), the control limits for the Individuals (I) chart can be calculated.
Center Line for I Chart (CLI)
The center line for the I chart is simply the average of all individual observations, denoted as \(\bar{X}\):
\[ \bar{X} = \frac{\sum_{i=1}^{n} X_i}{n} \]The Core of Variability Estimation: Average Moving Range and \(d_2\)
To set control limits for the I chart, an estimate of the process standard deviation (\(\hat{\sigma}\)) is needed. Since we have individual observations rather than subgroups, this estimate is derived from the average moving range (\(\overline{MR}\)). The relationship is:
\[ \hat{\sigma} = \frac{\overline{MR}}{d_2} \]Here, \(d_2\) is another control chart constant that depends on the sample size used for the range calculation (which is 2 for the moving range between two consecutive points). For a sample size of 2, \(d_2 \approx 1.128\).
The 2.66 * Moving Range Average Method
The control limits for the I chart are typically set at \(\pm3\) standard deviations from the center line (\(\bar{X}\)). Using the estimate of \(\sigma\) derived from \(\overline{MR}\):
\[ UCL_I = \bar{X} + 3 \hat{\sigma} = \bar{X} + 3 \left( \frac{\overline{MR}}{d_2} \right) \] \[ LCL_I = \bar{X} - 3 \hat{\sigma} = \bar{X} - 3 \left( \frac{\overline{MR}}{d_2} \right) \]Substituting \(d_2 \approx 1.128\):
\[ \frac{3}{d_2} = \frac{3}{1.128} \approx 2.65957 \]This value is commonly rounded to 2.66. This constant (3/\(d_2\)) is also known as \(E_2\) for individual observations (n=1). Therefore, the control limits for the I chart, using the "2.66 * Moving Range Average" method as highlighted in ISO 7870-2, are:
\[ UCL_I = \bar{X} + 2.66 \times \overline{MR} \] \[ LCL_I = \bar{X} - 2.66 \times \overline{MR} \]This method, endorsed by ISO 7870-2:2023, provides a statistically robust and standardized approach for establishing the natural variation boundaries for individual process measurements. It is widely adopted because it offers a reliable way to estimate process variation when subgrouping is not possible.
Summary Table: I/MR Chart Control Limit Formulas
The following table summarizes the formulas for calculating the center lines and control limits for both the Individuals (I) chart and the Moving Range (MR) chart, assuming a moving range based on two consecutive observations.
| Chart Component | Element | Formula | Constants Used (for MR of size 2) |
|---|---|---|---|
| Individuals (I) Chart | Center Line (CLI) | \(\bar{X}\) | N/A |
| Upper Control Limit (UCLI) | \(\bar{X} + 2.66 \times \overline{MR}\) (or \(\bar{X} + E_2 \times \overline{MR}\)) |
\(E_2 = 3/d_2 \approx 2.66\) (\(d_2 \approx 1.128\)) |
|
| Lower Control Limit (LCLI) | \(\bar{X} - 2.66 \times \overline{MR}\) (or \(\bar{X} - E_2 \times \overline{MR}\)) |
\(E_2 = 3/d_2 \approx 2.66\) (\(d_2 \approx 1.128\)) |
|
| Moving Range (MR) Chart | Center Line (CLMR) | \(\overline{MR}\) | N/A |
| Upper Control Limit (UCLMR) | \(D_4 \times \overline{MR}\) | \(D_4 \approx 3.267\) | |
| Lower Control Limit (LCLMR) | \(D_3 \times \overline{MR}\) | \(D_3 = 0\) |
Note: \(\bar{X}\) is the average of individual observations, and \(\overline{MR}\) is the average moving range.
Visualizing I/MR Chart Concepts
To better understand the interconnected elements of I/MR charts and their calculation, the following mindmap provides a visual overview. It outlines the foundational principles of SPC, the specifics of I/MR charts, the crucial role of ISO 7870-2, and the steps involved in control limit calculation.
Monitors Process Mean"] ["Moving Range (MR) Chart
Monitors Process Variability"] ["When to Use I/MR Charts"] (ISO 7870-2:2023 Standard) ["Guidance for Shewhart Charts"] ["Endorsement of Calculation Methods"] (Control Limit Calculation) (MR Chart Limits) ["Calculate Moving Ranges (MRi)"] ["Average Moving Range (MR-bar)"] ["CL_MR = MR-bar"] ["UCL_MR = D4 * MR-bar"] ["LCL_MR = D3 * MR-bar (often 0)"] (I Chart Limits) ["Average of Individuals (X-bar)"] ["Estimate Sigma from MR-bar:
sigma_hat = MR-bar / d2"] ["CL_I = X-bar"] (The 2.66 * MR-bar Method) ["Factor 2.66 = 3 / d2 (approx 3 / 1.128)"] ["UCL_I = X-bar + 2.66 * MR-bar"] ["LCL_I = X-bar - 2.66 * MR-bar"] (Practical Application) ["Data Requirements"] ["Importance of MR Chart Stability"] ["Interpreting Signals"]
Key Factors for Effective I/MR Charting
The effectiveness of I/MR charts in process monitoring and improvement depends on several interconnected factors. The radar chart below illustrates the relative importance of these factors and how they are often prioritized in typical implementations. Understanding these aspects can help organizations maximize the benefits derived from using I/MR charts.
This chart suggests that while factors like correct calculation and data accuracy are deemed highly important, areas such as operator training and consistent interpretation might receive less focus in practice, potentially impacting overall SPC effectiveness.
I/MR Control Chart in Practice: A Visual Guide
For a practical demonstration of how I/MR charts are constructed and used, including examples of calculations and interpretations, the following video provides a detailed walkthrough. It helps to solidify the concepts discussed and shows the application of these charts in real-world scenarios.
This video, "I-MR Control Chart: Detailed illustration with Practical Example," explains the creation and application of I/MR charts, aligning with the principles discussed.
Practical Considerations for I/MR Chart Implementation
Successfully implementing I/MR charts involves more than just correct formula application. Several practical aspects must be considered:
- Data Quality and Collection: Ensure data is accurate, reliable, and collected in chronological order. The measurement system itself should be stable and capable (consider Measurement System Analysis).
- Sufficient Data for Initial Limits: Typically, at least 20-25 data points are recommended to calculate initial control limits. These limits should be considered trial limits and recalculated as more data becomes available.
- Process Stability During Baseline: The initial data used to calculate control limits should ideally represent a period when the process is stable and only common cause variation is present. If known special causes affected the baseline data, those points might need to be excluded or accounted for.
- Rational Sampling: Although I/MR charts use individual observations, ensure that these observations are taken in a way that is representative of the process and that the time between samples is logical.
- Interpreting Out-of-Control Signals: Beyond points falling outside control limits, look for other non-random patterns (e.g., runs, trends, cycles) that can indicate special cause variation. Standard rules (like Western Electric rules or Nelson rules) can be applied, but use them judiciously.
- Regular Review and Revision: Control limits are not static. They should be reviewed periodically and recalculated if there's evidence that the process has fundamentally changed (either improved or degraded).
Conclusion
The Individuals and Moving Range (I/MR) chart is an indispensable tool in Statistical Process Control for monitoring processes with individual data points. The preferred method for calculating its control limits, particularly for the Individuals (I) chart, is the "2.66 * Moving Range Average" method, as robustly defined and supported by the ISO 7870-2:2023 standard. This approach provides a statistically sound basis for distinguishing between common and special cause variation, enabling timely interventions and fostering continuous process improvement.
By understanding the derivation of the 2.66 factor (from \(3/d_2\)) and correctly applying the formulas for both the I chart and the MR chart, organizations can effectively harness the power of I/MR charts to achieve greater process stability, reduce defects, and enhance overall quality performance. Adherence to the principles outlined in ISO 7870-2 ensures a standardized and reliable application of these powerful statistical tools.
Frequently Asked Questions (FAQ)
Recommended
- Explore a comparison of different types of control charts and their suitability for various data types.
- Learn about the Western Electric rules and other methods for interpreting non-random patterns on control charts.
- Understand the relationship between Measurement System Analysis (MSA) and the reliability of data used in SPC charts.
- Discover the practical steps and best practices for investigating and responding to an out-of-control signal on an I/MR chart.
Search Results
 cdn.standards.iteh.ai
cdn.standards.iteh.ai
cdn.standards.iteh.ai
 img.antpedia.com
cdn.standards.iteh.ai
cdn.standards.iteh.ai
img.antpedia.com
cdn.standards.iteh.ai
cdn.standards.iteh.ai